They aren't interactive. They won't impress trendy developers. And they can look pretty hideous. They are Google Charts. And, despite all that, they're kind of awesome.
I wouldn't blame you if you looked at this Google Chart, taken from the official documentation, and considered writing them off. The colors are garish. The data values are difficult to judge. The 3D shape muddles your view. The headline looks lame.
But behind that ugly chart is a powerful application. And if it's used wisely, it can live up to the highest standards.
The Tufte Challenge
For as long as I've been paying attention, people smarter than me have been talking about a guy named Edward Tufte. He's the Billy Graham of information graphics. Tufte travels the country, preaching his gospel to large crowds, encouraging designers to produce economical graphics that present data as clearly as possible.
In his widely recommended book The Visual Display of Quantitative Information, Tufte lays out, step-by-step, how the standard bar chart can be tuned to perfection (pp. 126-128).
To prove once and for all that Google Charts need not be hideous, I will now use them to recreate Tufte's carefully crafted charts. And, with the guidance of my ingenious coworker Thomas Suh Lauder, I will, just for the hell of it, attempt to surpass the master.
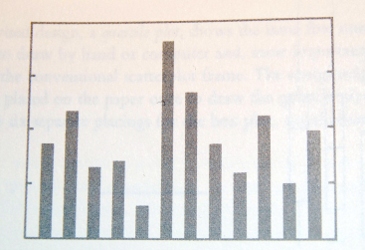
First, we start with a bar chart that Tufte describes as conventional. A picture from Tufte's book is on the left, and the Google Chart is on the right.
Since a Google Chart is nothing more than an automatically generated image, you can review the code for each one simply by right-clicking the image and copying out the URL.
Tufte's first move is to cut the ink along the border.

Then he clips the y-axis, leaving the tick marks.

Tufte raises the ante by inserting white coordinate lines that segment each bar at the y-axis intervals, something I've matched thanks to a hack Tom developed. Tufte also removes the tick marks, replacing them with y-axis labels.

And, with his final move, Tufte removes the y-axis labels.

Now, for the fun part. We will defy the master. We will improve the chart.
First, by adding x-axis labels that indicate the difference between each column. I like to imagine there's one bar for each month.
Then we will add the precise y-axis value for each bar, which gives the reader a much higher level of precision than any previous indicator.
That's cute, but now what?
Good question. None of these example make Google Charts any easier to figure out. And, let's be real, those crazy URL parameters are tough to get your head around.
My hope is this exercise can convince you that Google Charts shouldn't be dismissed. They can look halfway good.
But, beyond appearances, they have a lot going for them on the backend, too.
If you integrate Google Charts with a database framework like Django, you can scale to the moon. At the Los Angeles Times, we use a branch of Jacob Kaplan-Moss's django-googlecharts to automatically generate thousands of charts about Census data in L.A. neighborhoods (check out the accordions). We can easily pull off Tom's coordinate line hack using some code I patched to the app. And, thanks to the magic of Python, we do it all without crafting a single crazy URL.
Elsewhere, we integrate a one-off Google Charts with a little CSS to mimic the style of the newspaper online. That's something you could replicate with the handy Google Chart Creator and a well-crafted HTML wrapper.
Once you're flying, Google Charts can save you a lot of time. You can make Tufte-approved charts without the help of a Flash developer or outside designer. And since they're nothing more than flat image files, they will immediately work in even the most difficult environments. What's not to love?