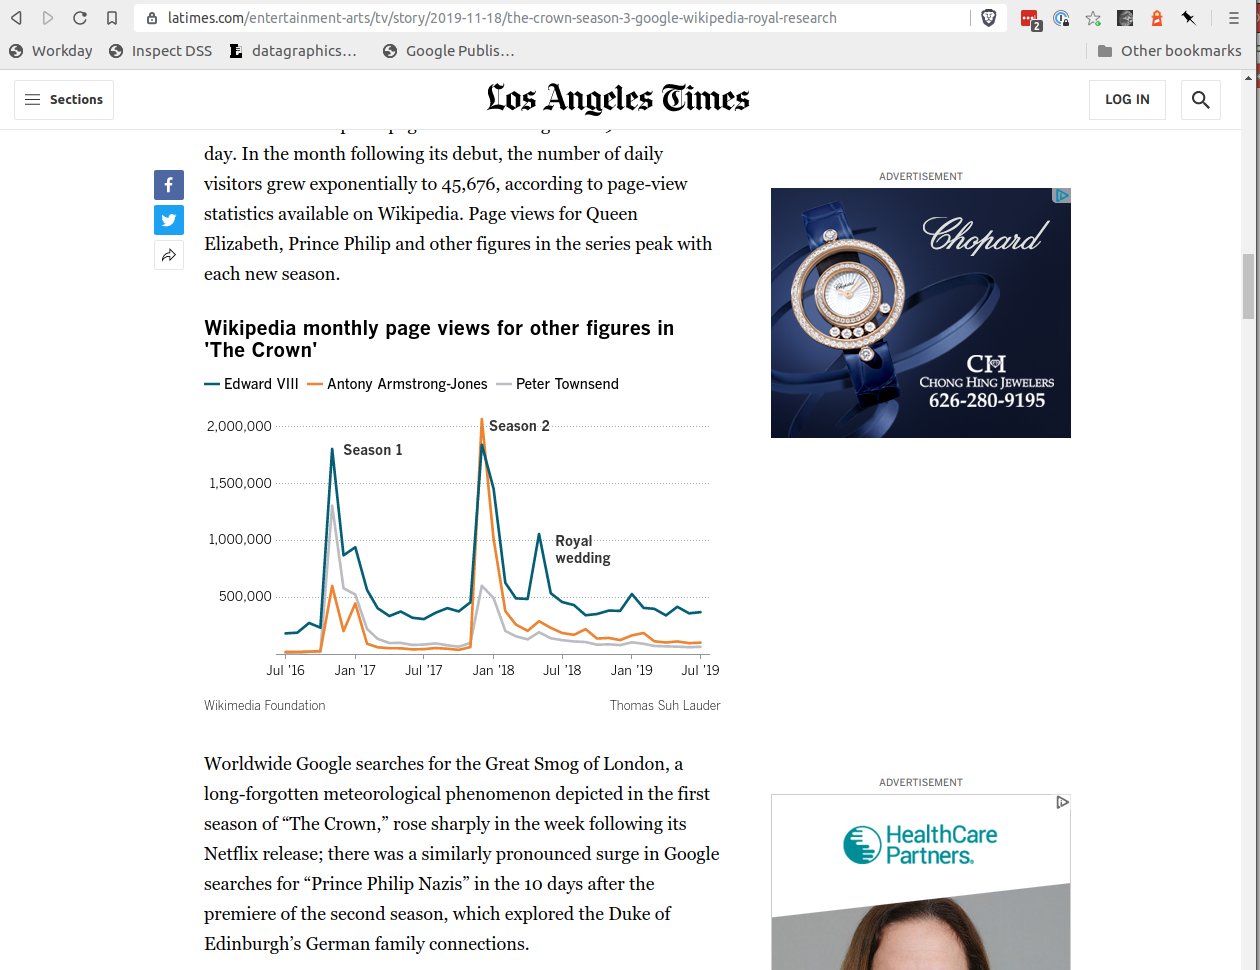
Today's Los Angeles Times features the first web charts shipped to print with no extra production.
No Adobe Illustrator. No CMYK conversion. No resizing.
One chart. Two outputs.
It's all thanks to Datawrapper tech, linked up with our system by Thomas Suh Lauder and Lorena Elebee.
It's fitting these charts appear in the Thanksgiving edition. They represent a significant streamlining of print work in the Data and Graphics Department.
Until today it required hours of staff time to double-produce simple charts for web and print.
Now, thanks to Datawrapper, it's this easy.
This is the latest in a series of steps we're taking to minimize production work and refocus the team on reporting and visual storytelling.
I can't do it alone.
That's why I'm hiring a deputy to rally our staff and drive visual coverage. Sound fun? DM me.
We're also looking for an aggressive reporter to join our graphics reporting team.
I want somebody who is fired up to get out there and cover the news with visualization, illustration and design.
Is that you? DM me.