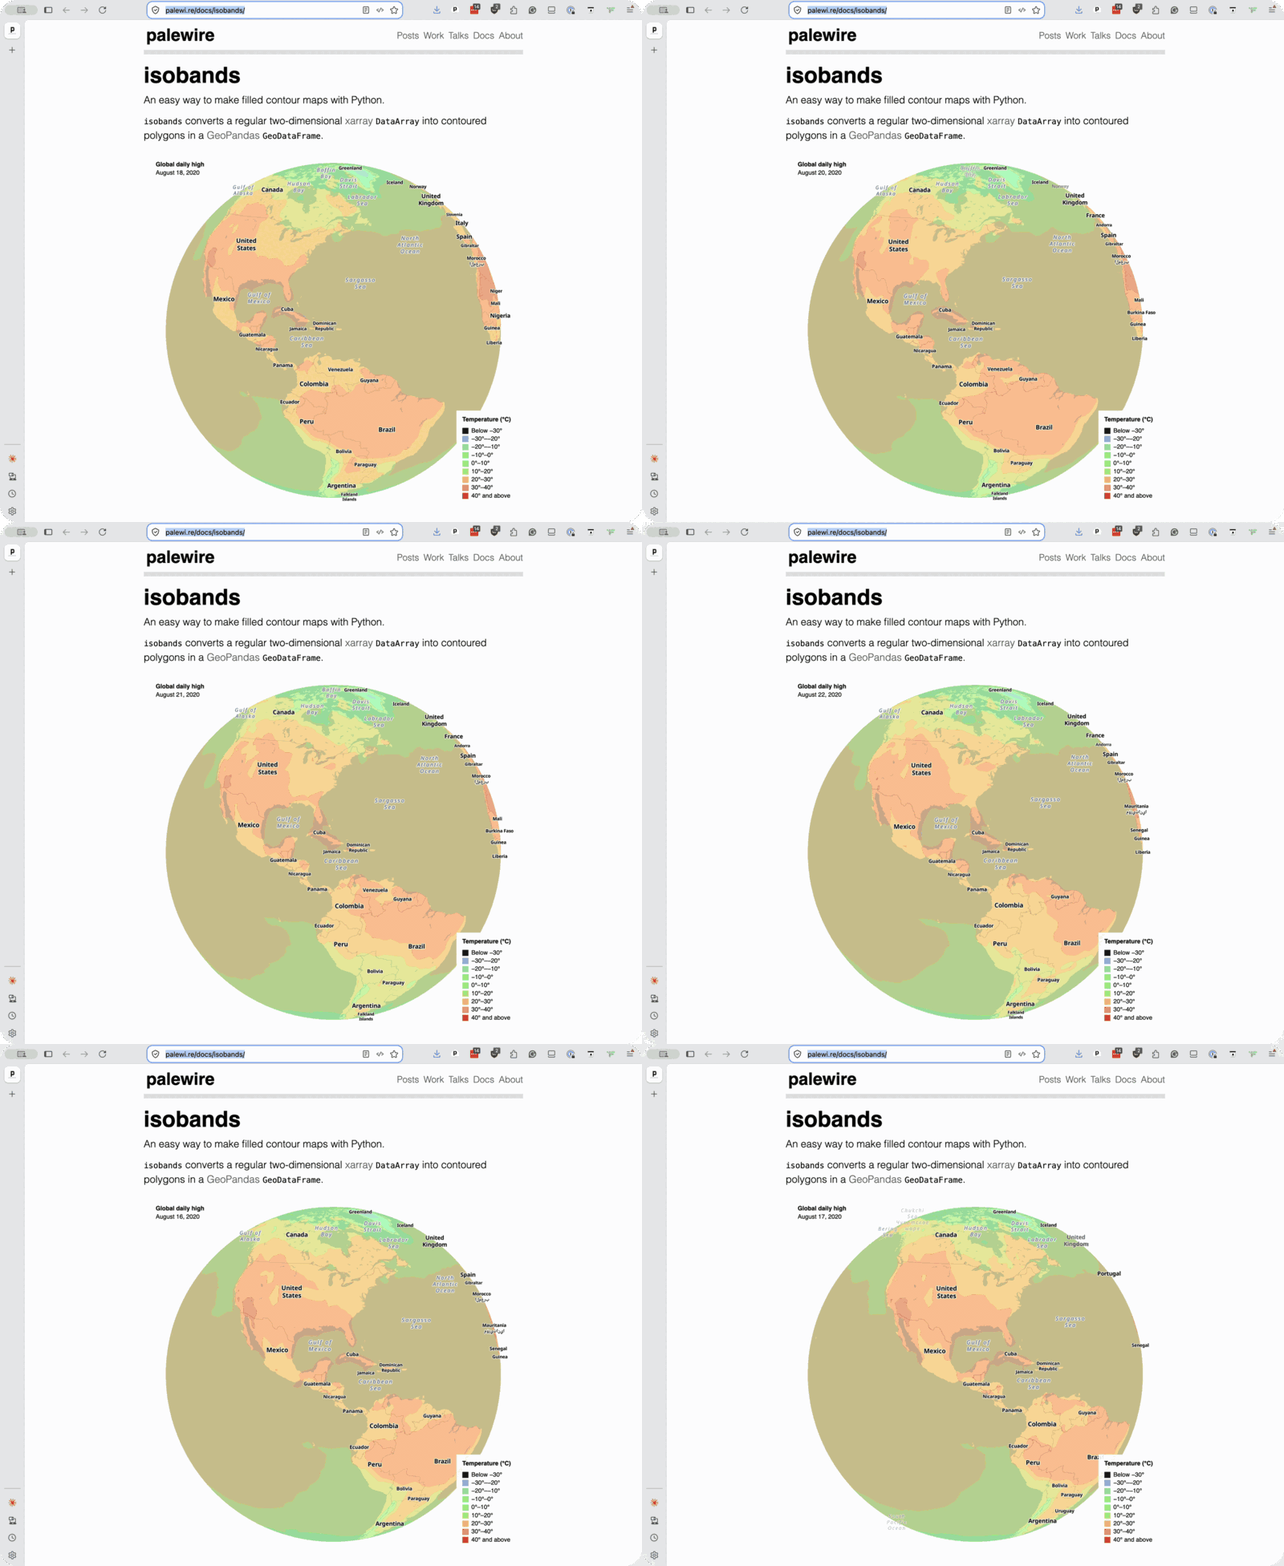
Today, I'm happy to release isobands, an open-source library that makes it easier to present a dense dataset as a smoothed-out map.
It uses the handy Python programming language to access GDAL, a powerful geospatial toolkit that can be difficult to use on its own.
Feed isobands any gridded dataset — temperatures, pollution, whatever you'd like — and it will return filled contours that you can immediately publish with common platforms like MapLibre, Mapbox and Esri.
My take is that it fills a gap in the existing open-source ecosystem. The most common tools are great at generating the contour lines used to plot elevation, overlooking the polygons used in other cases, like the weather maps we're all used to seeing on television.
This release is an outgrowth of the Reuters Climate Monitor, our real-time dashboard that aims to track the slow-moving effects of climate change at the speed of news.
I hope to spin off more utilities from our work in the months ahead. Recent advances in machine learning make it easier than ever to package, document and release computer code.
You can see how I harness AI agents by checking out my template for Python projects, which I recently overhauled to better take advantage of tools like GitHub Copilot, Anthropic's Claude and OpenAI's Codex.