1. What you will make
If you work through this class, you will create an interactive map of the world that can display whatever data you’d like.
This type of map is often called a “basemap” because it provides a foundation for displaying data layers like weather conditions, election results, demographics or the location of newsworthy events.
Here’s an example of the basemap you will make displayed using the MapLibre GL JavaScript library and the OSM Liberty styles released by Maputnik.
Until recently, creating a basemap was a difficult task that required specialized skills and expensive servers. Rather than take on the challenge, many organizations chose to pay for access to commercial mapping services, which can be costly for applications that draw a lot of traffic.
Then open-source software changed the equation.
The new PMTiles file format allowed for the massive database needed to render a detailed map of the world to be stored and served efficiently from a single file.
That means you no longer need a complex, fragile cloud service to render maps. All it takes to escape an expensive mapping contract is to convert the free-and-open OpenStreetMap database to the new format.
That’s not all. Because the map is stored as a single static file, it requires no maintenance. There are no databases to patch, no servers to update. Upload the file once and it works indefinitely.
This class will show you how to make this new style of basemap using free code and cheap cloud-computing services. A recent trial cost less than $10. Once you’re done, your only ongoing cost will be hosting files on Amazon S3 or a competitor service, where the costs will depend on how much traffic your map generates.
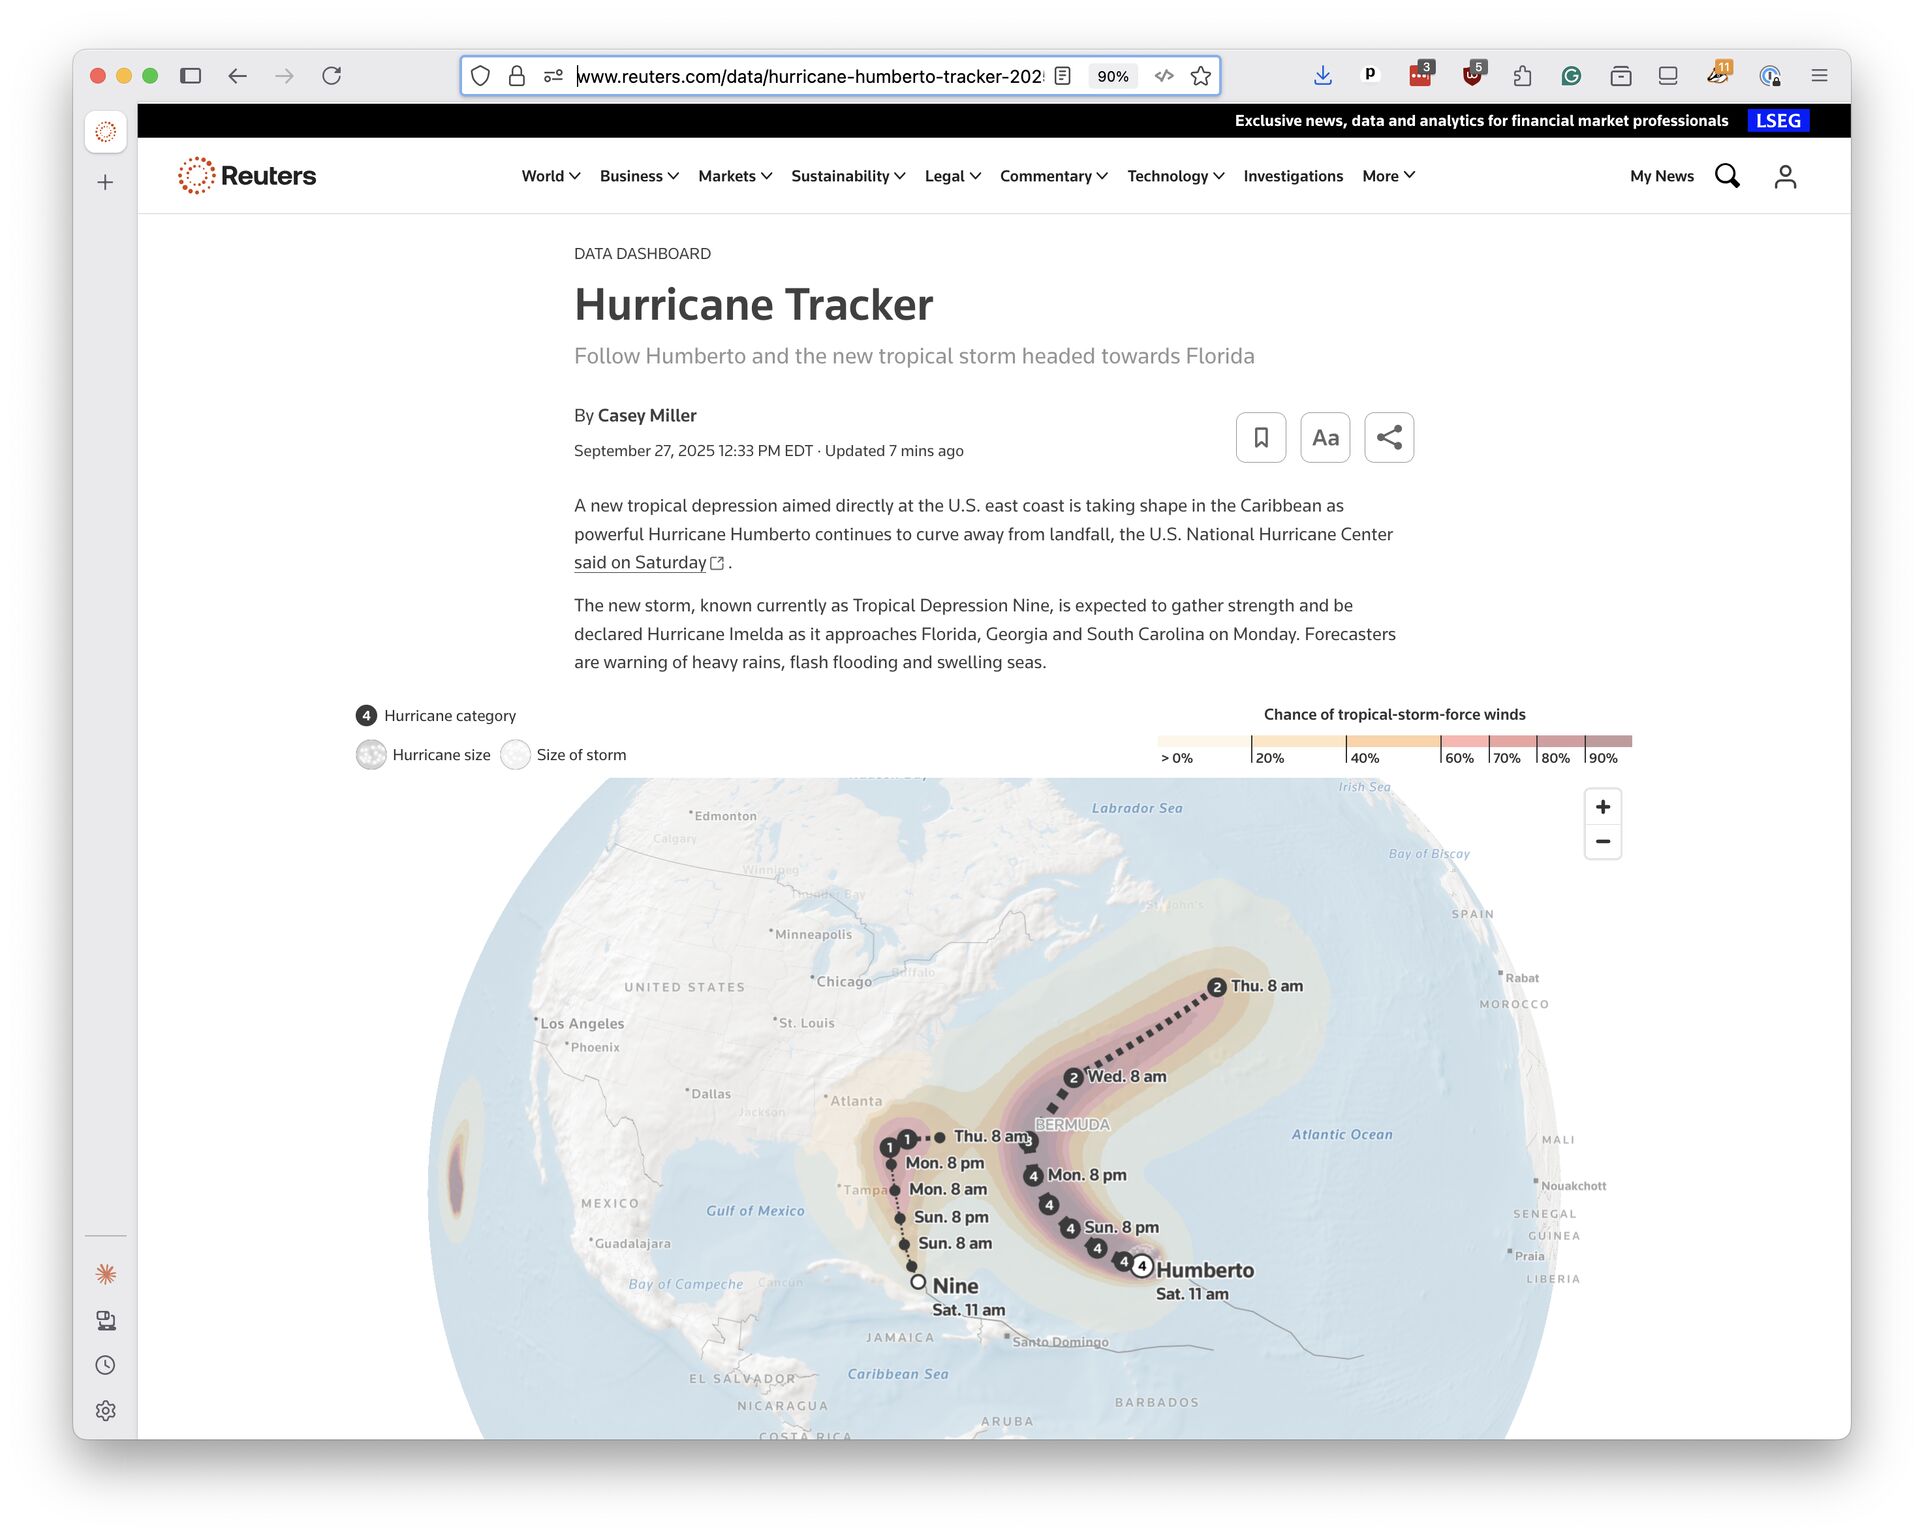
The steps we’ll work through were mapped out in the summer of 2025 at Reuters, the world’s largest multimedia news provider. The newsroom uses its basemap as the foundation for publishing its data-driven journalism. In one example, Reuters journalist Casey Miller used it to track hurricane activity and share the latest maps with readers.
Note
The development of the Reuters basemap was led by Scott Reinhard, who has written a detailed explanation of his design process on his blog. While the fonts, styles and other customizations he tailored for Reuters are copyrighted, the underlying techniques are free for anyone to adapt.
1.1. What it takes
The chief challenge in creating a basemap is the size of the massive database containing almost every border, road, building and natural feature on the planet. Processing that much data requires powerful computers that can run for hours.
We’ve solve this problem by linking GitHub Actions, a cloud-computing service for managing and running tasks, with the powerful servers provided by Amazon Web Services. It will take a lot of different tools to get the job done, but none of them are difficult to use. Once you have everything sorted out, making a new basemap is as simple as pushing a button.
Ready?