Minor milestone today at Reuters.
Data dashboards are now one of our standard storytelling templates, joining the familiar arsenal of text articles, photo galleries and blogs. Going forward, publishing a live-updating collection of charts, maps and tables will require nothing more than a few points and clicks.
First through the gate is “The Magnificent Seven Monitor,” which tracks the ongoing performance of the heavyweight U.S. technology stocks that dominate the market.
Anyone who has toiled in the vineyards of news knows it’s hard to integrate custom designs like this into the rigid, cookie-cutter “content-management systems” that power most media sites. As a result, many data projects and long-form investigations are published off-the-reservation using shadow technology.
While there are advantages to working outside your core platform, there are downsides, too. Every new publishing tool must tackle how to integrate with your site design, your homepage, your recirculation system, your ads, your analytics, your paywall, and the workflow of your colleagues. That’s a lot.
At Reuters, we aim to bridge the divide once and for all. That requires treating the innovative story forms pioneered over the last twenty years — multimedia stories, interactive visuals, live-updating data — like the other widgets we manufacture in our “CMS.”
Today’s release is a modest first step in that direction. Now that we have the technology issues sorted out, we’ll do more and better in the months ahead. Give it a look. Let me know what sucks, and what more we could do. I am happy to answer any Q’s in the comments.
Here are a couple of extras for the nerds.
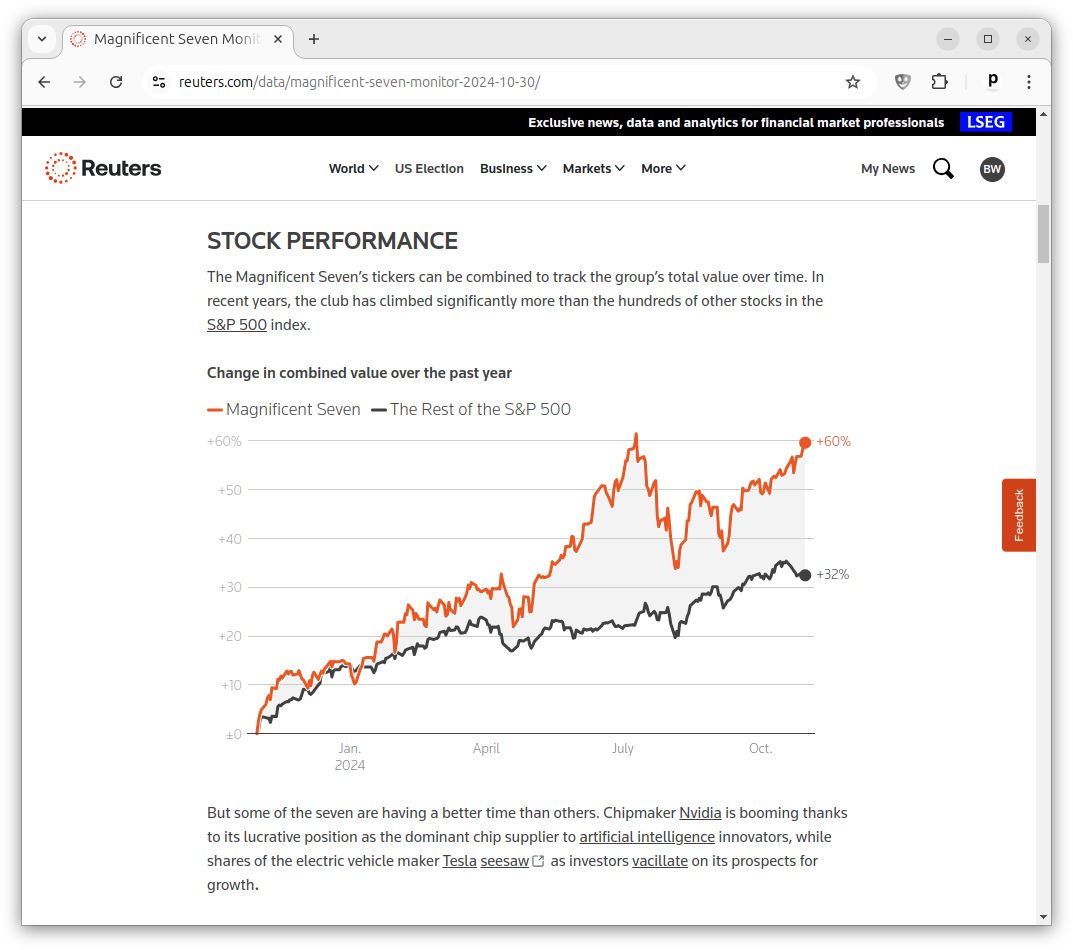
Our original work in the tracker, which you won’t find elsewhere, is a composite ticker that lumps all seven stocks into a single number and my attempt to simplify the “stochastic oscillators” favored by Wall Street “technicals.”
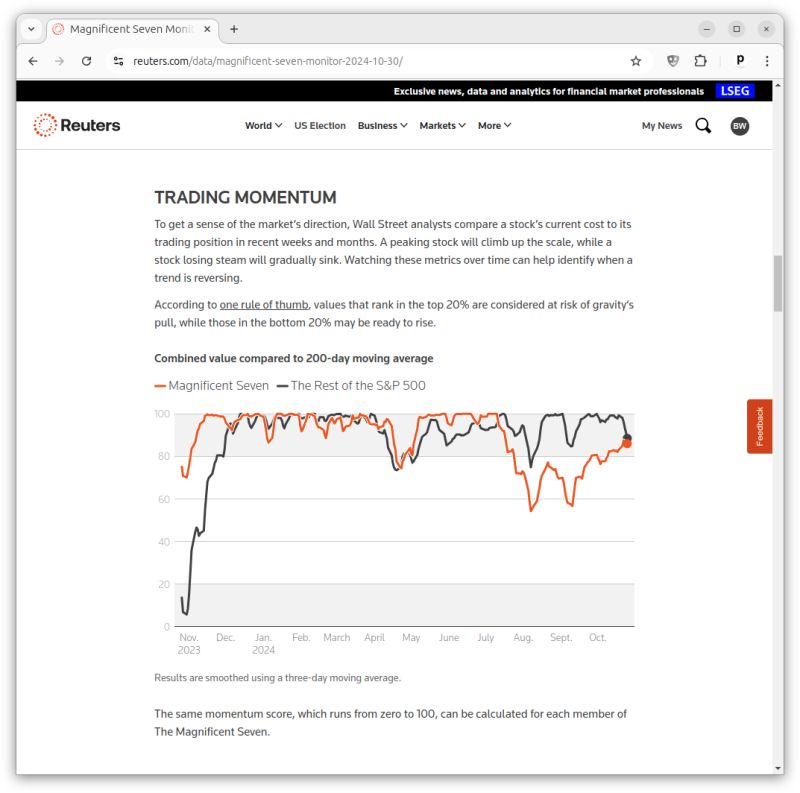
Here’s the code that runs the momentum calculation. Feel free to hate it!
Not into numbers? Word nerds can read my interview with Michael Harnett, the Bank of America analyst who dubbed the group, also out today.