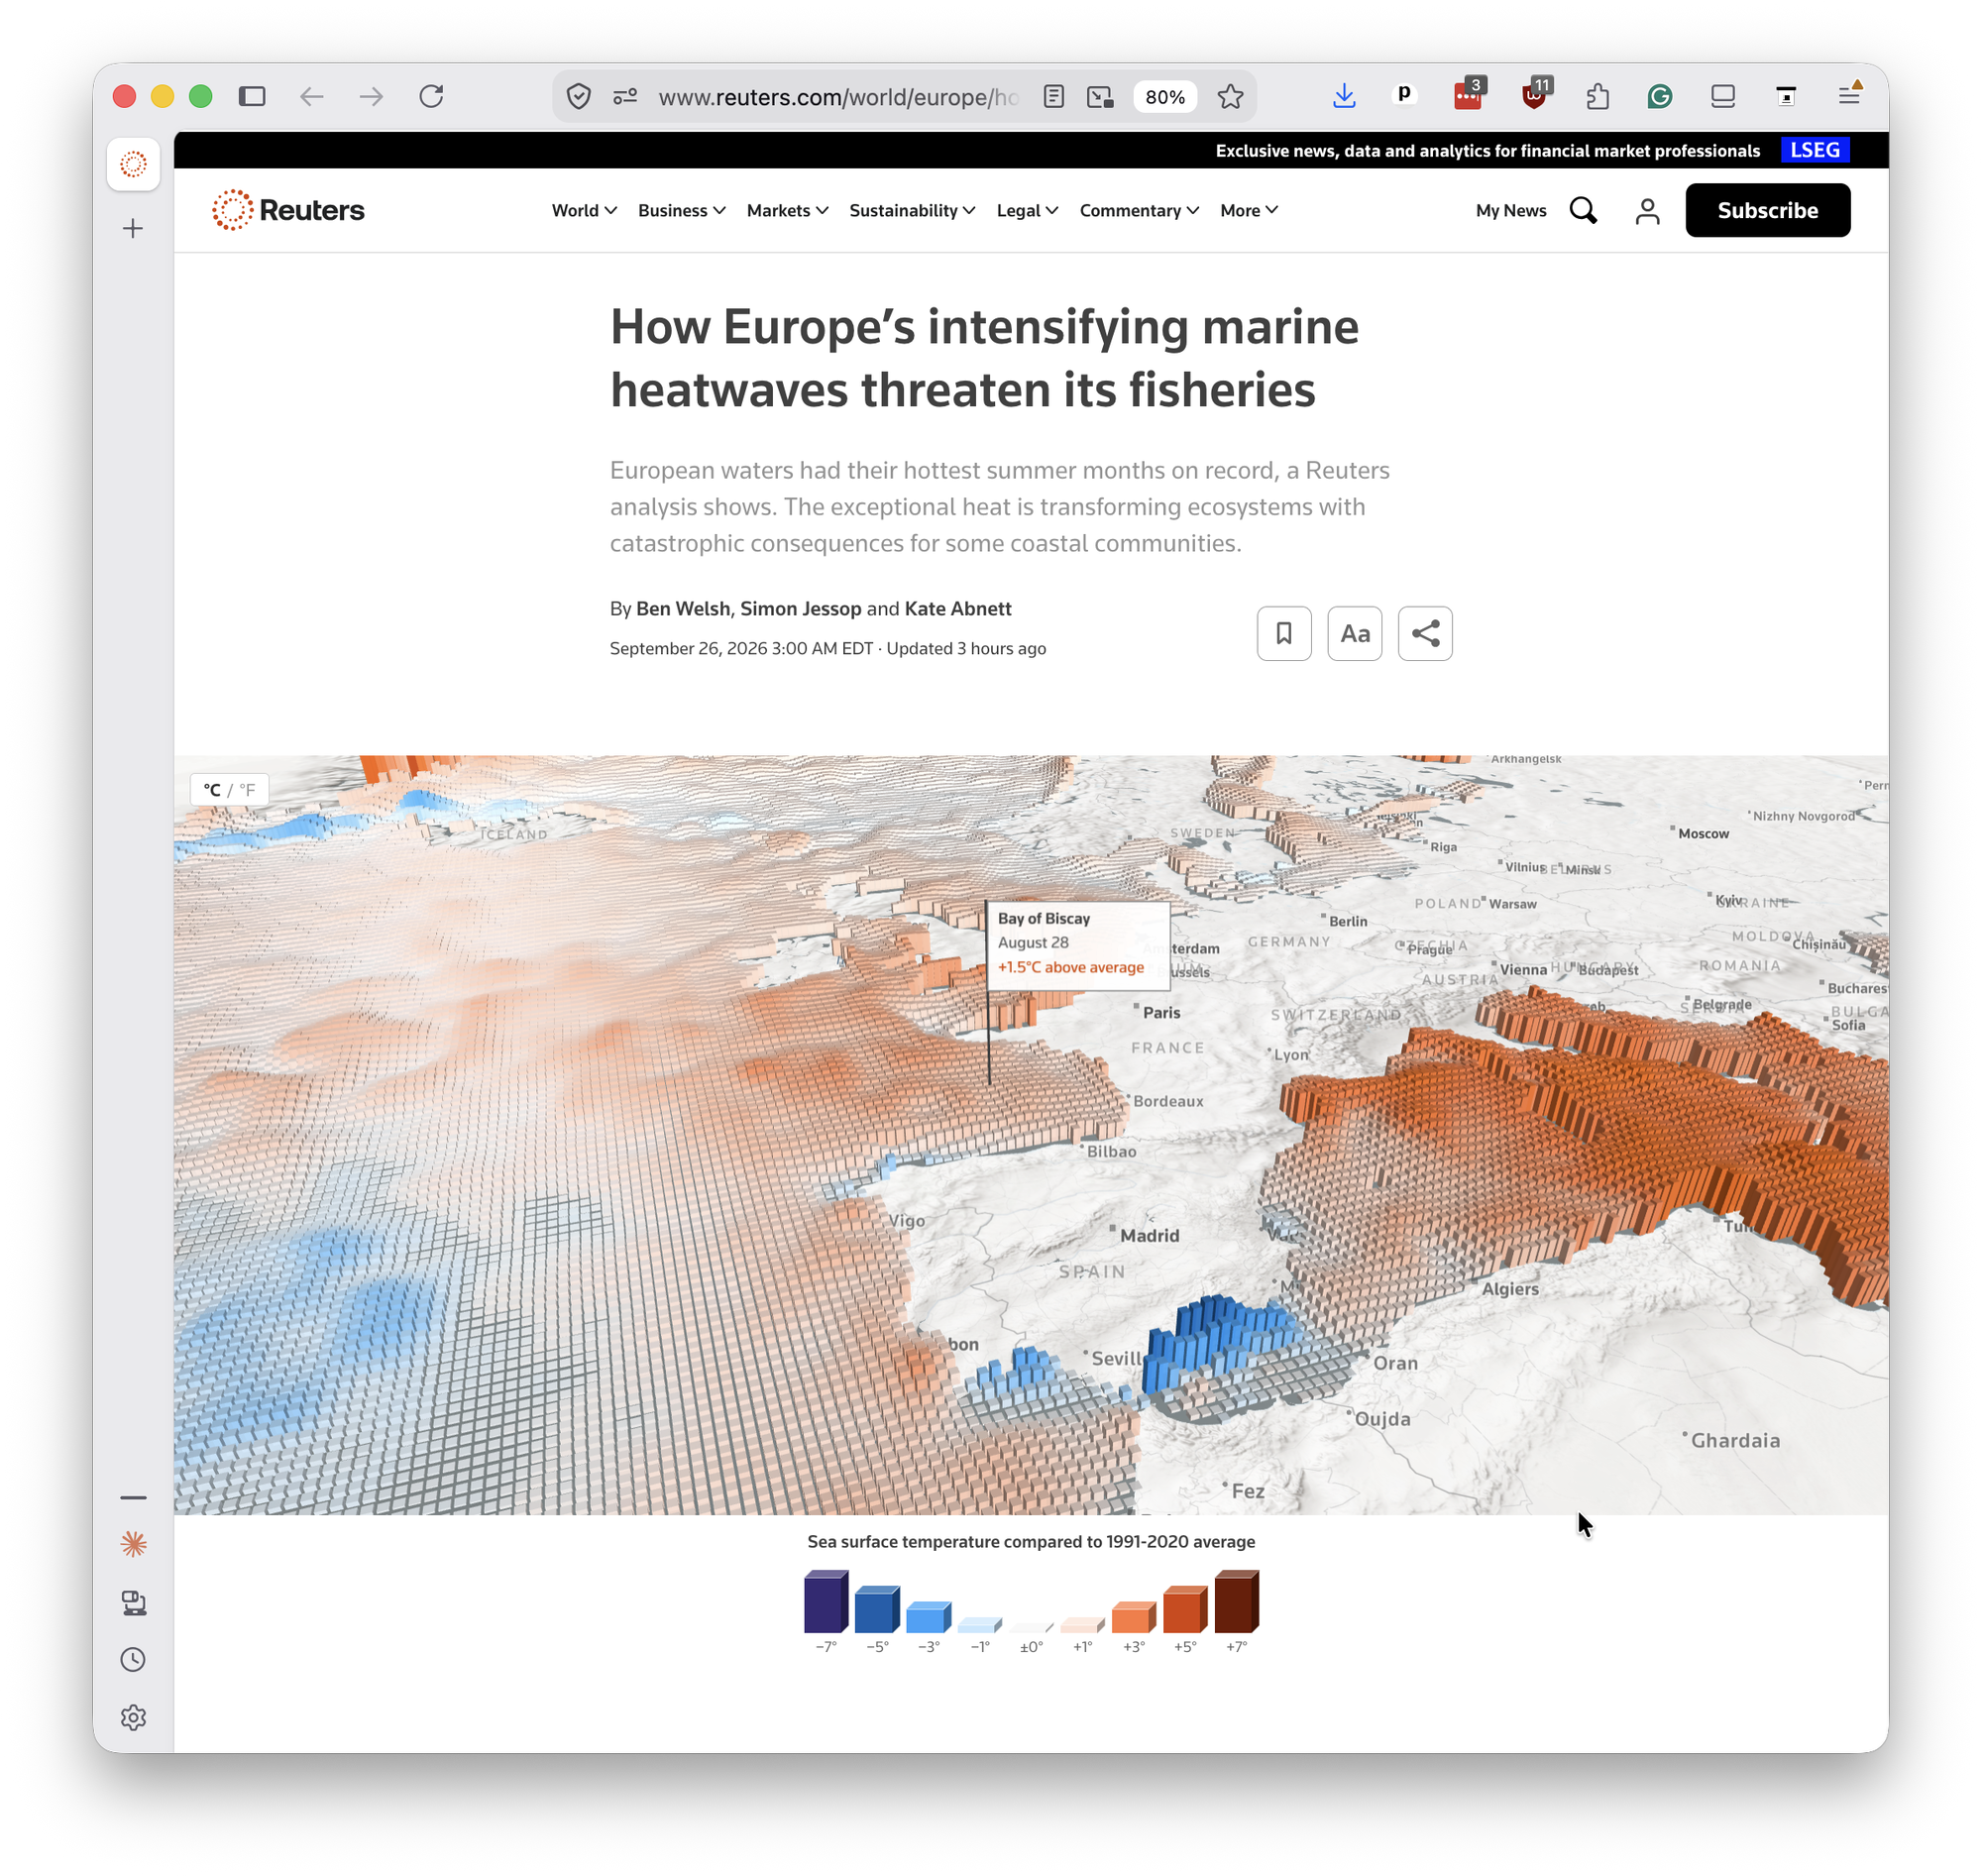
Check out my new story, published today, about how intensifying marine heatwaves are threatening the future of local fisheries across Europe.
It's the weekend's feature from Reuters, assembled by a global team of reporters and editors, and based on my analysis of the rising tide of sea-surface temperatures.
Taken together, European seas averaged 21.6 C (70.9 F) between June and August, the highest in 45 years of available data.
To investigate the impact of increasing heat, we toured the northern coast of Spain and trawled the English Channel, speaking with the fishermen, scientists, and other lifelong residents of coastal communities forced to grapple with the transformation of the marine ecosystems they rely on to earn a living.
It's the kind of sweep that wouldn't be possible without my many talented colleagues. I'm grateful to Simon Jessop, Kate Abnett, Alexandra Zavis and Rachel Armstrong for dragooning me into their platoon. Maria Alejandra Cardona did intrepid work following the leads pulled out of my spreadsheets along the Cantabrian coastline.
Putting together stories like this isn't my full-time job here in the New York newsroom, where my group's primary focus is on the automation efforts I've written about in previous posts.
But it's an example of the data journalism that first got me excited about pursuing our craft, where charts and graphs alone aren't enough to make the story, they're just the start. When we follow numbers out into the world, to test their accuracy and discover their stakes, that's when things can really get interesting.
Unfortunately, that exercise is more possible than ever on the climate beat. Global warming is no longer some scientist's theory about a far-off future. It's a present reality that we can all see and feel.
Making sense of that story is what inspired us this summer to launch the Reuters Climate Monitor, a live data dashboard that aims to track the slow-moving impact of climate change at the speed of the news.
And we are far from done using it to produce stories like this one. Stay tuned. There's more on the way.
For anyone interested in my methods, the code and data behind today's analysis are available as open source on GitHub.