1. What you will make
As part of this class, you’ll gain a basic understanding of how graphics, design and data teams in the journalism industry build customized webpages.
The tutorial will demonstrate how to:
Use a command-line interface to issue commands
Write JavaScript, HTML and CSS within a static-site framework
Publish a microsite with GitHub’s Pages
By the end of this lesson, you will deploy a standalone page with a series of graphics examining the high homicide rate in Harvard Park, a small neighborhood in South Los Angeles.
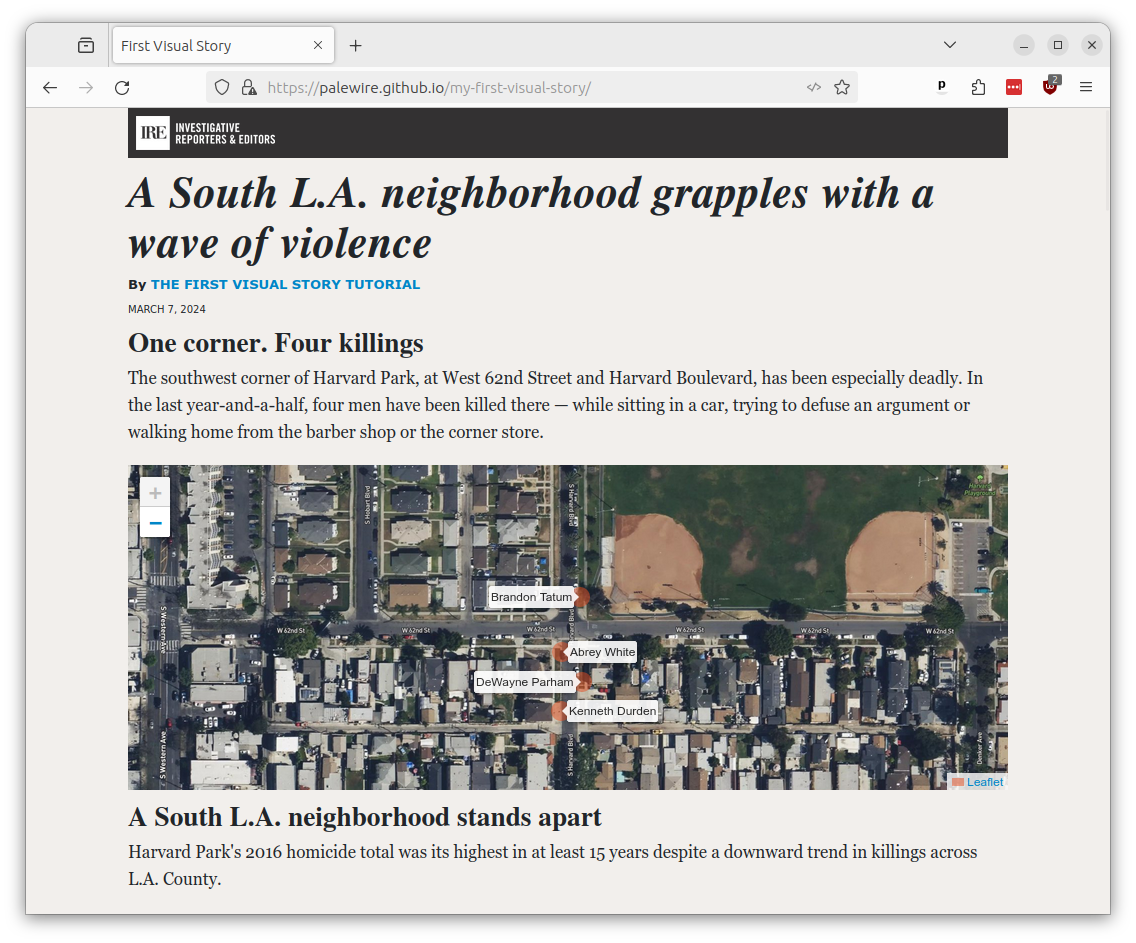
You will create the page by repurposing data from a 2017 Los Angeles Times story by Nicole Santa Cruz and Cindy Chang.
A working example can be found at palewire.github.io/first-visual-story/