10. Map
Next we’ll move on to creating a map focused on West 62nd Street and Harvard Boulevard, an intersection in South Los Angeles where four men died in less than a year and a half.
To draw the map we will rely on Leaflet, a library for creating interactive maps. We’ll also be writing a bit of JavaScript.
This is a long section, and you’ll probably run into bugs! That’s a normal part of development, and we’ll teach you how to identify and debug them when they come up.
10.1. Installing Leaflet
We will install it just as before by using npm from our terminal. This should install the latest version of leaflet, which at the time of writing was 1.7.
npm install leaflet
Next we import Leaflet’s stylesheets in styles/app.scss so that they are also included on our site. We do this by using @use and the path to a file.
// RESET
// Smooths out the rough edges across browsers
@use './tools/normalize';
@use 'node_modules/leaflet/dist/leaflet';

// VARIABLES
Now, back in the index.html template, we should create a placeholder in the page template where the map will live. Let’s set it right above the charts section we’ve just finished.
<div id="map"></div>

<section>
    <h3>A South L.A. neighborhood stands apart</h3>
    <p>Harvard Park's 2016 homicide total was its highest in at least 15 years despite a downward trend in killings across L.A. County.</p>

    <div class="charts-holder clearfix">
        <div class="inline-chart" id="county-homicides"></div>
        <div class="inline-chart" id="harvard-park-homicides"></div>
    </div>
</section>
To bring the map to life, add a new file named map.js to the scripts directory. For now, let’s just put a simple console.log statement in there.
console.log("This is the map file")
Now, when you load the page, you can open up the console with cmd + option + i, or by going to View -> Developer -> Developer Tools in the menu. You won’t see this message yet!

Why is that? Because we still need to import it in to app.js, which is where all the JavaScript in our app is read.
In your app.js file:
// Write your code!
console.log("Hello bakers");

import "./map";
Whenever something isn’t working in our app, this is usually where we’ll find the answer.
Now we need to import Leaflet into scripts/map.js so that its tools are available in this file.
import * as L from 'leaflet';
This imports everything under a variable called L. You can confirm this by adding a line in your map.js file, right below the import statement. This allows you to see the contents of that variable.
import * as L from 'leaflet';

console.log("Leaflet", L);
If you open your console you’ll be able to see it. If you click on the little triangle, you can actually see all of the different leaflet methods and properties available.

10.2. Making your first map
Now in scripts/map.js paste in the following Leaflet code to generate a simple map. It does three things:
creates a new map in the HTML element with an ID of “map” that we made in the previous steps,
adds a new map layer of satellite imagery overlaid with roads, borders, water and other features from OpenStreetMap,
finally, adds the layer to the map.
import * as L from 'leaflet';

const map = L.map('map');
const satelliteLayer = L.tileLayer(
  'https://api.mapbox.com/styles/v1/mapbox/satellite-streets-v9/tiles/{z}/{x}/{y}?access_token=pk.eyJ1IjoibGF0aW1lcyIsImEiOiJjanJmNjg4ZzYweGtvNDNxa2ZpZ2lma3Z4In0.g0lYVIEs9Y5QcUOhXactHA'
);
satelliteLayer.addTo(map);
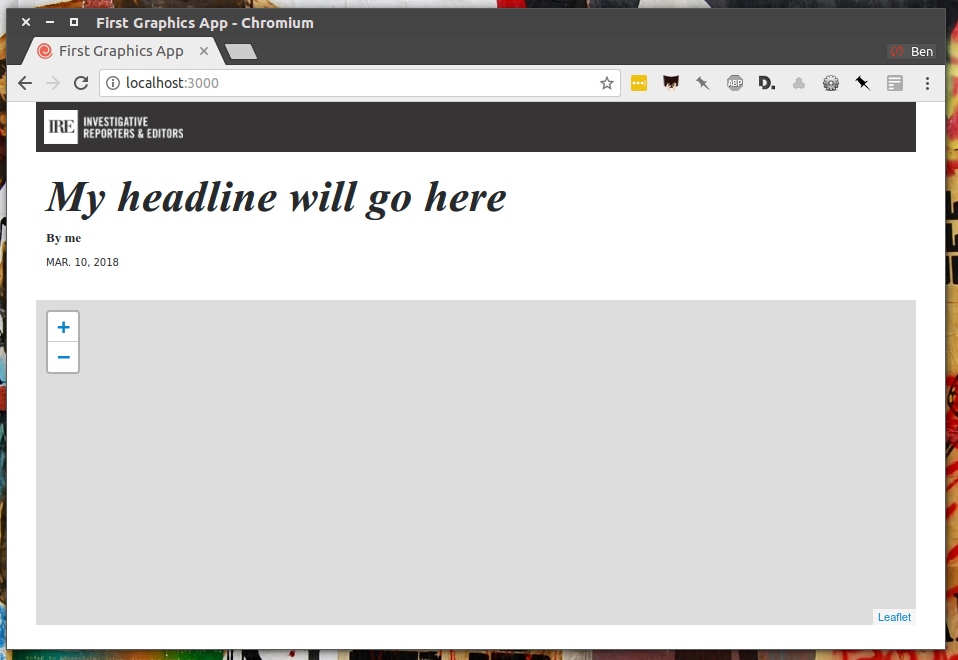
After you save, the index page should reload with a blank map.
Note
Assigning variables
You’ll notice that we just declared a couple of variables: map and satelliteLayer with the word const. This is how you declare a “constant” variable in JS, or something that won’t change.
You can also use let, which lets you change a value after assigning, but in most cases it’s better to use const until you need to use let.
In older JS you would have used var to declare variables. This is still valid, but const/let are more commonly used and have fewer gotchas.
To zero in on the area we’re reporting on, we will need its longitude and latitude coordinates. Go to Google Maps and find 62nd Street and Harvard Boulevard in South LA. Hold down a click until it gives you the coordinates in a popup box. Paste those numbers into Leaflet’s setView method with a zoom level of 15 included.
const map = L.map('map')
const satelliteLayer = L.tileLayer('https://api.mapbox.com/styles/v1/mapbox/satellite-streets-v9/tiles/{z}/{x}/{y}?access_token=pk.eyJ1IjoibGF0aW1lcyIsImEiOiJjanJmNjg4ZzYweGtvNDNxa2ZpZ2lma3Z4In0.g0lYVIEs9Y5QcUOhXactHA');
satelliteLayer.addTo(map);
map.setView([33.983265, -118.306799], 15);
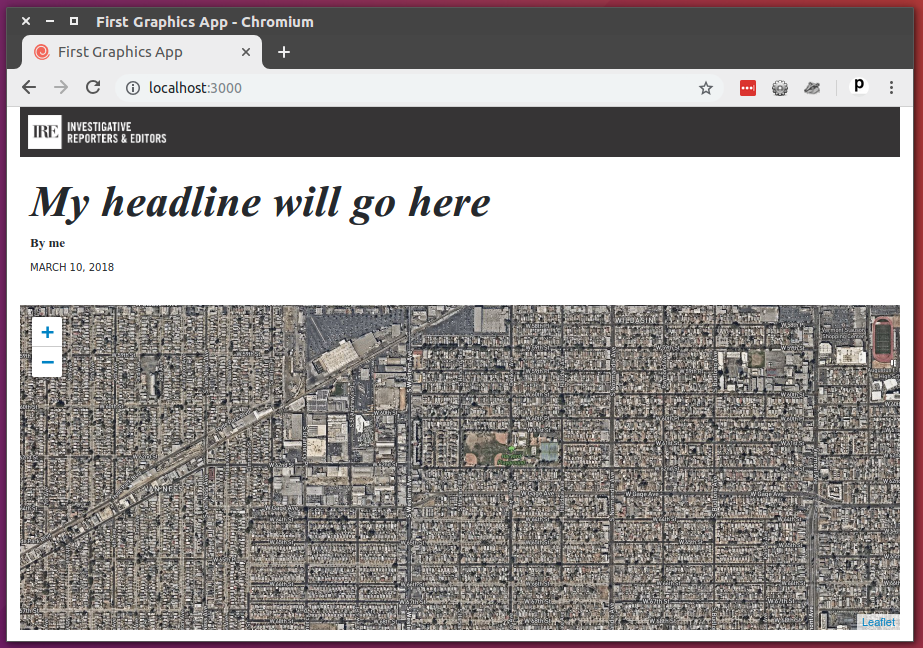
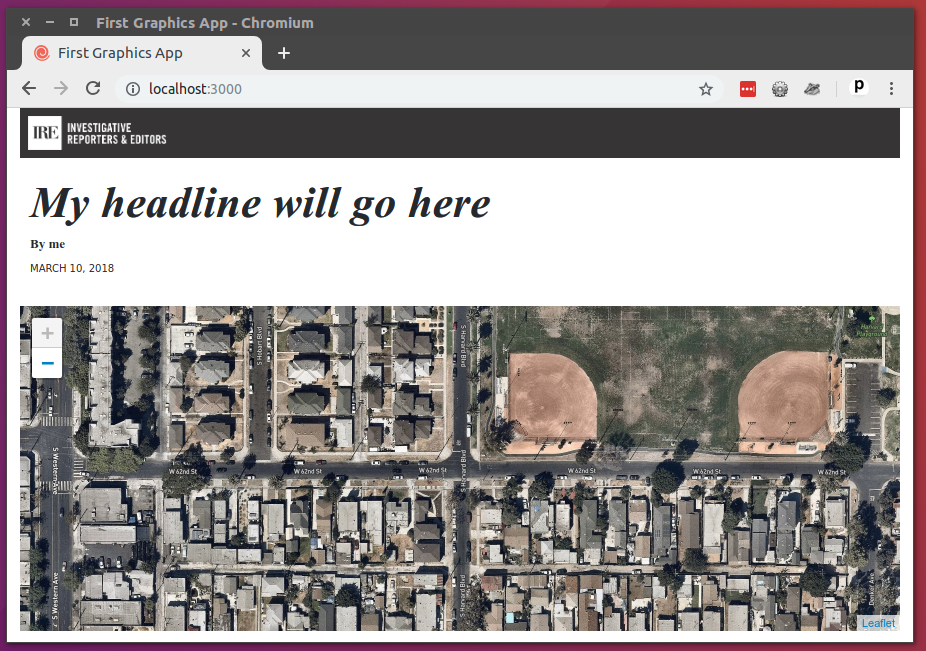
After you save the file, your map should have loaded the location you specified. Let’s zoom in a bit and save again. Change the zoom level to 18.
const map = L.map('map')
const satelliteLayer = L.tileLayer('https://api.mapbox.com/styles/v1/mapbox/satellite-streets-v9/tiles/{z}/{x}/{y}?access_token=pk.eyJ1IjoibGF0aW1lcyIsImEiOiJjanJmNjg4ZzYweGtvNDNxa2ZpZ2lma3Z4In0.g0lYVIEs9Y5QcUOhXactHA');
satelliteLayer.addTo(map);
map.setView([33.983265, -118.306799], 18);
10.3. Putting data on the map
Now let’s load some data on the map. We will return to the list of all homicides already stored in _data/harvard_park_homicides.json.
Import the homicides data into _map.js.
import * as L from "leaflet";
import homicides from "../_data/harvard_park_homicides.json";
If you look in the _data/harvard_park_homicides.json file, you’ll see that every record has a latitude and longitude associated with it. We can use these to place each homicide as a point on the map.
{
    "case_number":"2017-04514",
    "slug":"eddie-rosendo-lino",
    "first_name":"Eddie",
    "middle_name":"Rosendo",
    "last_name":"Lino",
    "death_date":"2017-06-18T00:00:00.000Z",
    "death_year":2017,
    "age":23.0,
    "race":"black",
    "gender":"male",
    "image":null,
    "longitude":-118.304107484,
    "latitude":33.9904336958
},
At the bottom add some JavaScript code that steps through the homicide list and adds each one to the map as a circle, just like the real Homicide Report.
const map = L.map('map')
const satelliteLayer = L.tileLayer('https://api.mapbox.com/styles/v1/mapbox/satellite-streets-v9/tiles/{z}/{x}/{y}?access_token=pk.eyJ1IjoibGF0aW1lcyIsImEiOiJjanJmNjg4ZzYweGtvNDNxa2ZpZ2lma3Z4In0.g0lYVIEs9Y5QcUOhXactHA');
satelliteLayer.addTo(map);
map.setView([33.983265, -118.306799], 18);

homicides.forEach(obj => {
    L.circleMarker([obj.latitude,  obj.longitude])
      .addTo(map)
});
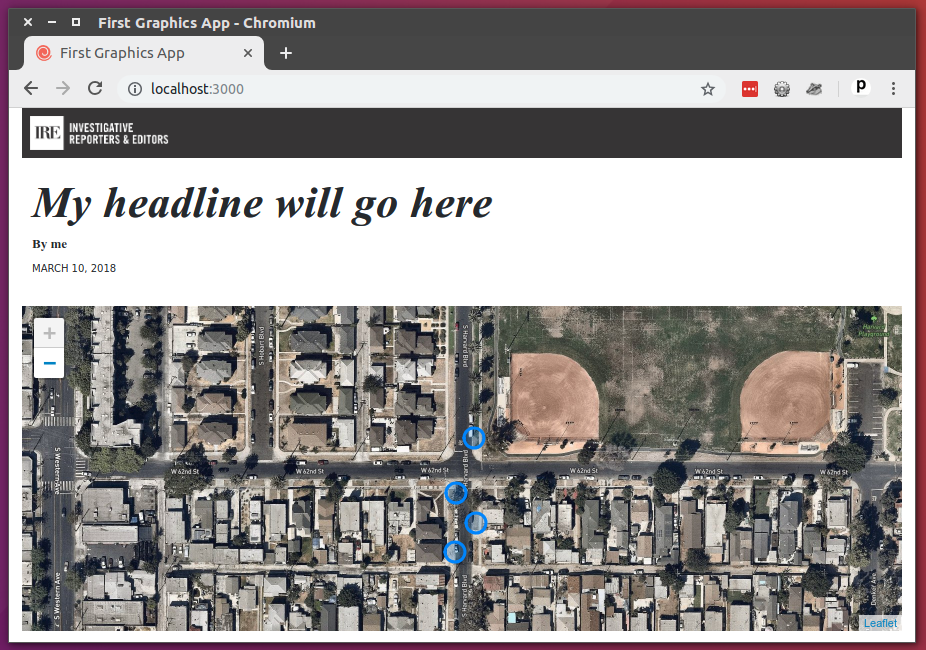
Save the file and you should now see all the homicides mapped on the page.
Note
Remember the for loop we used in the data section? homicides.forEach() is how you would write the same in JavaScript. Every language is a little different!
Next, extend the code you just wrote in scripts/map.js to add a tooltip label on each point.
homicides.forEach(obj => {
    L.circleMarker([obj.latitude,  obj.longitude])
      .addTo(map)
      .bindTooltip(obj.first_name + " " + obj.last_name);
})
Here’s what you should see after you do that.
10.4. Styling the data
Next let’s add some styles to our page to make the circles match the orange color of the dots found on The Homicide Report. As we did with the charts, go to the styles folder and create a new file. We’ll call this one map.scss. In that file, copy or write the following:
#map path {
  fill: #e64d1f;
  fill-opacity: 0.5;
  stroke-opacity: 0;
}
Just as before, that won’t change anything until you import our new file into the main stylesheet. Again, use @use to introduce your CSS file into main.css
// RESET
// Smooths out the rough edges across browsers
@use './tools/normalize';
@use 'node_modules/leaflet/dist/leaflet';
@use './map';
After you save, here’s what you’ll get.

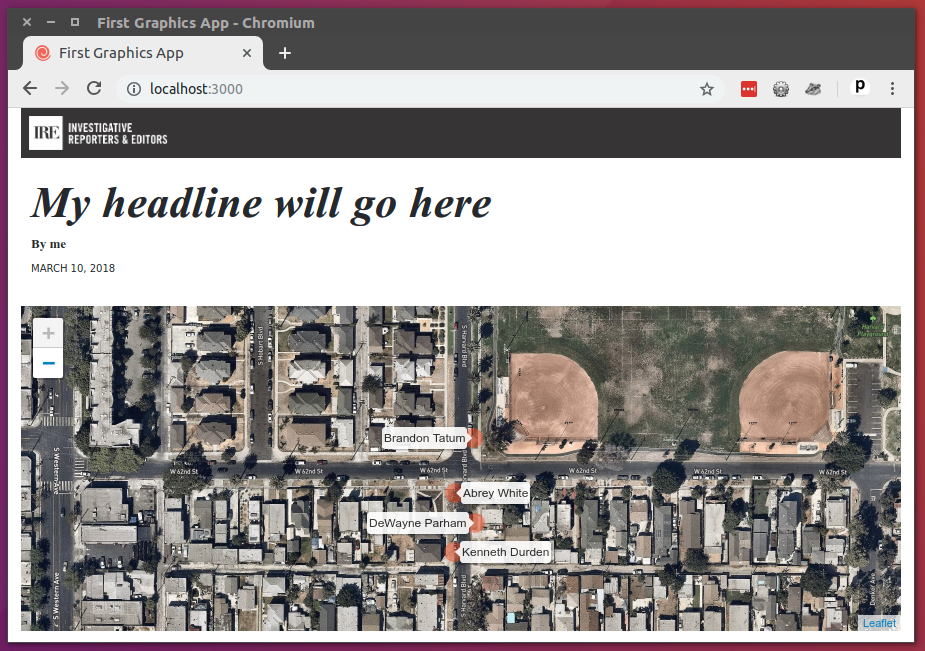
If you want to make the tooltips visible all the time, edit the JavaScript in scripts/map.js to make the tooltips “permanent.”
homicides.forEach(obj => {
    L.circleMarker([obj.latitude,  obj.longitude])
      .addTo(map)
      .bindTooltip(obj.first_name + " " + obj.last_name, {permanent: true});
});
Here they are.
10.5. Adding a minimap
Alright. We’ve got an okay map. But it’s zoomed in so close a reader might now know where it is. To combat this problem, graphic artists often inset a small map in the corner that shows the the area of focus from a greater distance.
Lucky for us, there’s already a Leaflet extension that provides this feature. It’s called MiniMap.
To put it to use, we’ll need to return to our friend npm.
$ npm install leaflet-minimap
Just as with other libraries, we need to import it into scripts/map.js
import * as L from "leaflet";
import MiniMap from "leaflet-minimap";
import homicides from '../_data/harvard_park_homicides.json';
Its stylesheets also need to be imported to styles/app.scss.
@use './tools/normalize';
@use 'node_modules/leaflet/dist/leaflet';
@use 'node_modules/leaflet-minimap/src/Control.MiniMap';
@use './map';
Now that everything is installed, return to scripts/map.js and create an inset map with the library’s custom tools. We can set its view with the maxZoom option.
const map = L.map('map')
const satelliteLayer = L.tileLayer('https://api.mapbox.com/styles/v1/mapbox/satellite-streets-v9/tiles/{z}/{x}/{y}?access_token=pk.eyJ1IjoibGF0aW1lcyIsImEiOiJjanJmNjg4ZzYweGtvNDNxa2ZpZ2lma3Z4In0.g0lYVIEs9Y5QcUOhXactHA');
satelliteLayer.addTo(map);
map.setView([33.983265, -118.306799], 18);

homicides.forEach(obj => {
    L.circleMarker([obj.latitude,  obj.longitude])
      .addTo(map)
      .bindTooltip(obj.first_name + " " + obj.last_name, {permanent: true});
})

const satelliteLayer2 = L.tileLayer('https://api.mapbox.com/styles/v1/mapbox/satellite-streets-v9/tiles/{z}/{x}/{y}?access_token=pk.eyJ1IjoibGF0aW1lcyIsImEiOiJjanJmNjg4ZzYweGtvNDNxa2ZpZ2lma3Z4In0.g0lYVIEs9Y5QcUOhXactHA', {
    maxZoom: 11
});
const miniMap = new MiniMap(satelliteLayer2);
miniMap.addTo(map);
Save the file and the inset map should appear on your page.
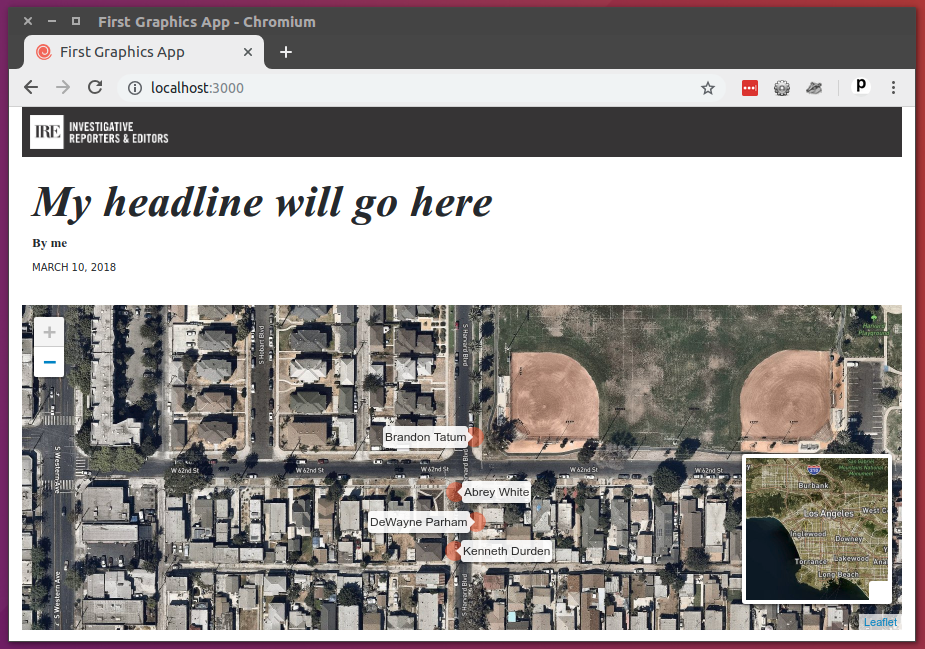
Just for fun, let’s add a couple creature comforts to map. By default, the scroll wheel on your mouse or laptop trackpad will trigger zooms on the map. Some people (Armand!) have strong feelings about this. Let’s do them a favor and turn it off. Replace the initial map definition with the highlighted lines.
const map = L.map('map', {
    scrollWheelZoom: false
});
const satelliteLayer = L.tileLayer('https://api.mapbox.com/styles/v1/mapbox/satellite-streets-v9/tiles/{z}/{x}/{y}?access_token=pk.eyJ1IjoibGF0aW1lcyIsImEiOiJjanJmNjg4ZzYweGtvNDNxa2ZpZ2lma3Z4In0.g0lYVIEs9Y5QcUOhXactHA');
satelliteLayer.addTo(map);
map.setView([33.983265, -118.306799], 18);

homicides.forEach(obj => {
    L.circleMarker([obj.latitude,  obj.longitude])
      .addTo(map)
      .bindTooltip(obj.first_name + " " + obj.last_name, {permanent: true});
})

const satelliteLayer2 = L.tileLayer('https://api.mapbox.com/styles/v1/mapbox/satellite-streets-v9/tiles/{z}/{x}/{y}?access_token=pk.eyJ1IjoibGF0aW1lcyIsImEiOiJjanJmNjg4ZzYweGtvNDNxa2ZpZ2lma3Z4In0.g0lYVIEs9Y5QcUOhXactHA', {
    maxZoom: 11
});
const miniMap = new MiniMap(satelliteLayer2);
miniMap.addTo(map);
10.6. Some cleanup
In general, it’s best to help users by keeping your map from views that aren’t part of the story. So while we’re at it, let’s also restrict the zoom level so it you can’t back too far away from our area of interest in South LA.
const map = L.map('map', {
    scrollWheelZoom: false
})
const satelliteLayer = L.tileLayer('https://api.mapbox.com/styles/v1/mapbox/satellite-streets-v9/tiles/{z}/{x}/{y}?access_token=pk.eyJ1IjoibGF0aW1lcyIsImEiOiJjanJmNjg4ZzYweGtvNDNxa2ZpZ2lma3Z4In0.g0lYVIEs9Y5QcUOhXactHA', {
    minZoom: 13
});
satelliteLayer.addTo(map);
map.setView([33.983265, -118.306799], 18);

homicides.forEach(function (obj) {
    L.circleMarker([obj.latitude,  obj.longitude])
      .addTo(map)
      .bindTooltip(obj.first_name + " " + obj.last_name, {permanent: true});
})

const satelliteLayer2 = L.tileLayer('https://api.mapbox.com/styles/v1/mapbox/satellite-streets-v9/tiles/{z}/{x}/{y}?access_token=pk.eyJ1IjoibGF0aW1lcyIsImEiOiJjanJmNjg4ZzYweGtvNDNxa2ZpZ2lma3Z4In0.g0lYVIEs9Y5QcUOhXactHA', {
    maxZoom: 11
});
const miniMap = MiniMap(satelliteLayer2);
miniMap.addTo(map);
Note
Other mapping libraries
We used Leaflet today, but this isn’t the only mapping tool you can use.
One of the most popular options for interactive mapping is Mapbox GL, which is fast and very flexible, but is not a free tool.
Other open-source options are MapLibre or OpenLayers. Or, go with embedded maps from Datawrapper.
10.7. Adding a headline and text
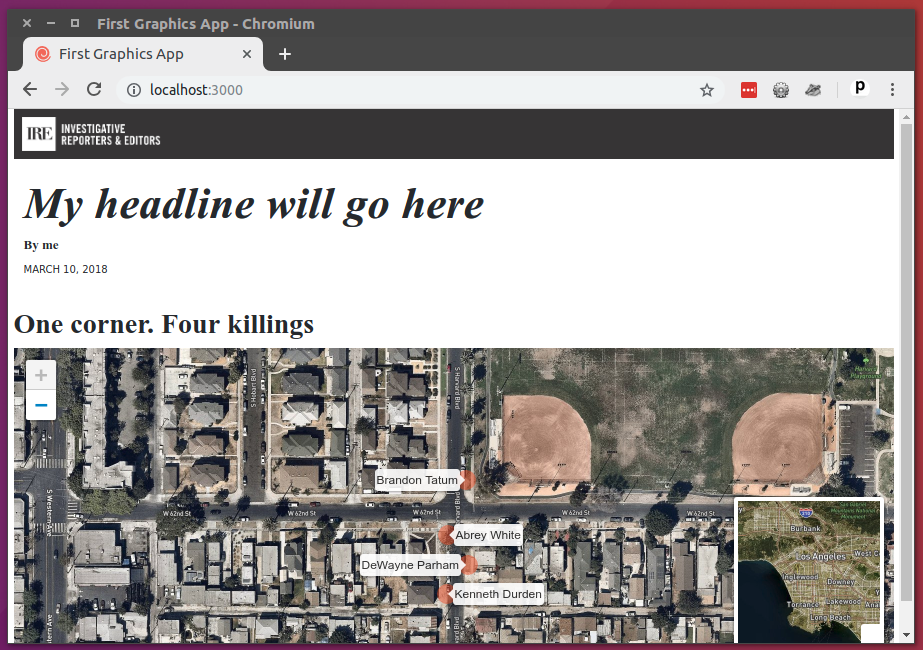
Finally, let’s preface the map with so a headline.
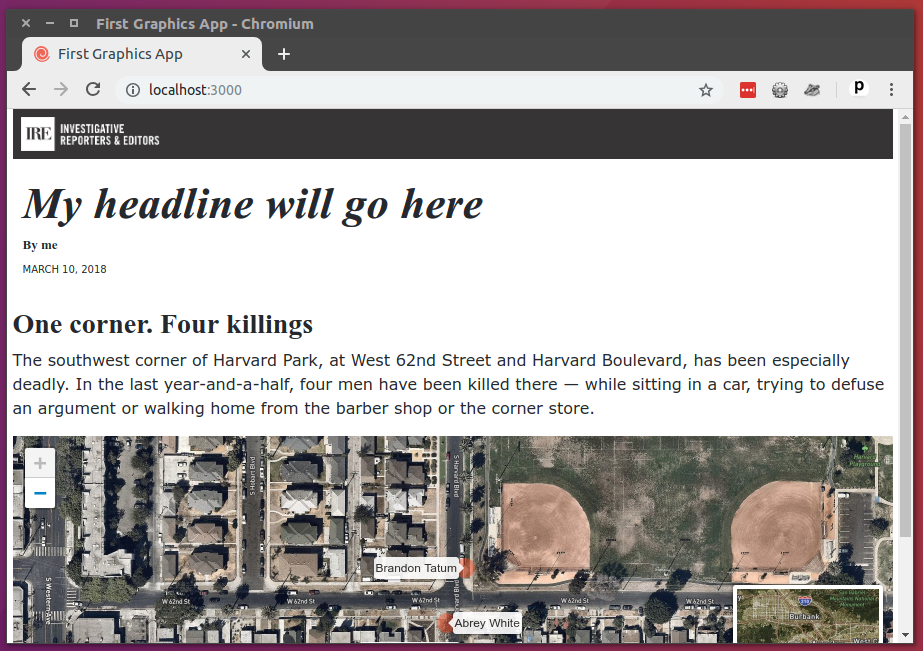
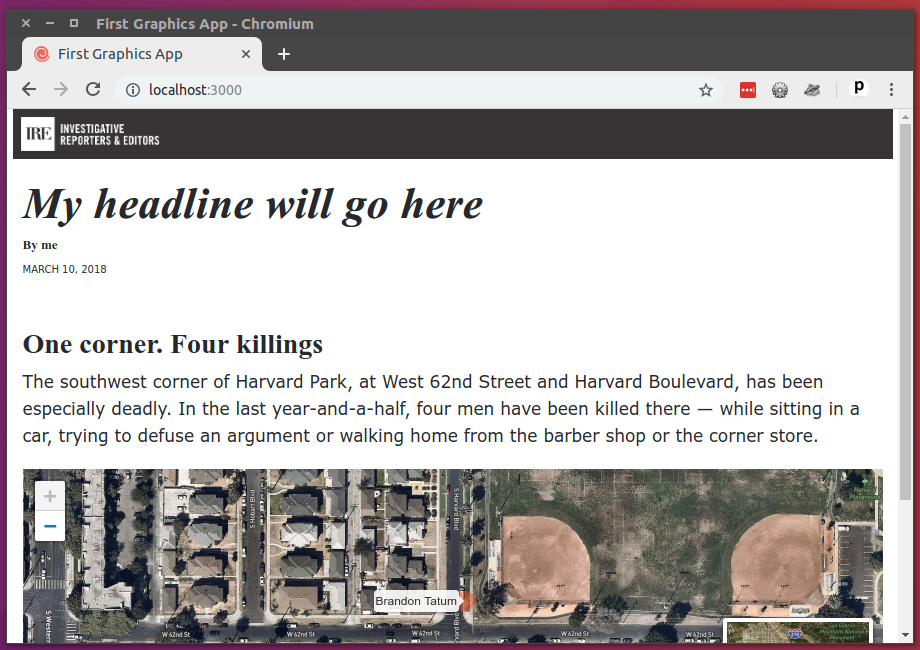
<h3>One corner. Four killings</h3>
<div id="map"></div>
Then an introductory paragraph.
<h3>One corner. Four killings</h3>
<p>The southwest corner of Harvard Park, at West 62nd Street and Harvard Boulevard, has been especially deadly. In the last year-and-a-half, four men have been killed there — while sitting in a car, trying to defuse an argument or walking home from the barber shop or the corner store.</p>
<div id="map"></div>
All wrapped up in a <section> tag.
<section>
    <h3>One corner. Four killings</h3>
    <p>The southwest corner of Harvard Park, at West 62nd Street and Harvard Boulevard, has been especially deadly. In the last year-and-a-half, four men have been killed there — while sitting in a car, trying to defuse an argument or walking home from the barber shop or the corner store.</p>
    <div id="map"></div>
</section>
Congratulations. You’ve created a custom map. Before we get on to the business of sharing it with the world, we need a couple more pieces here.
Hey. How about a headline?
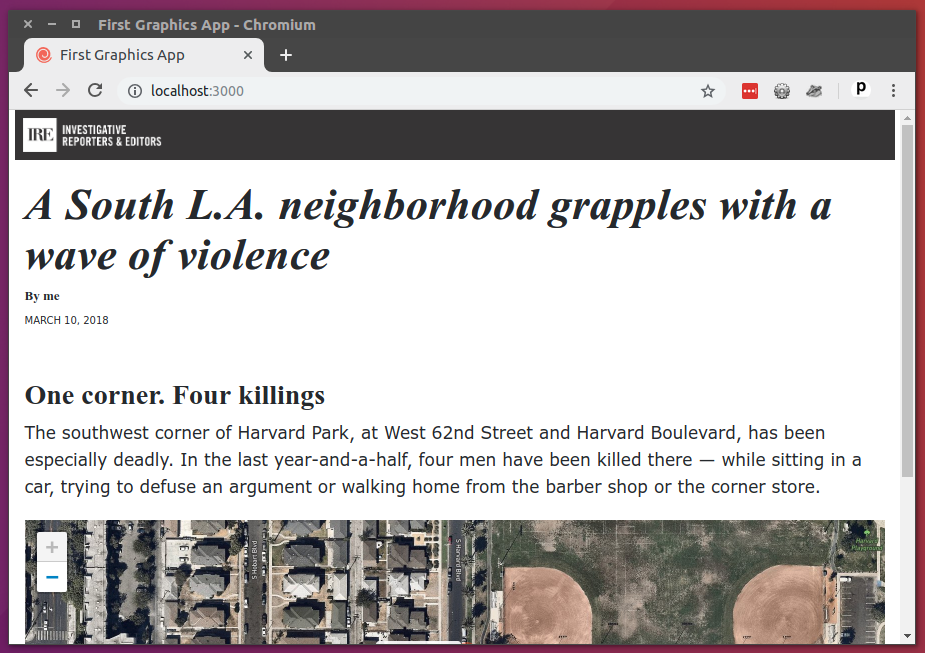
{% block headline %}A South L.A. neighborhood grapples with a wave of violence{% endblock headline %}
{% block byline %}By me{% endblock byline %}
{% block pubdate %}
    <time datetime="2020-03-07" pubdate>Mar. 7, 2020</time>
{% endblock pubdate %}
And a real byline.
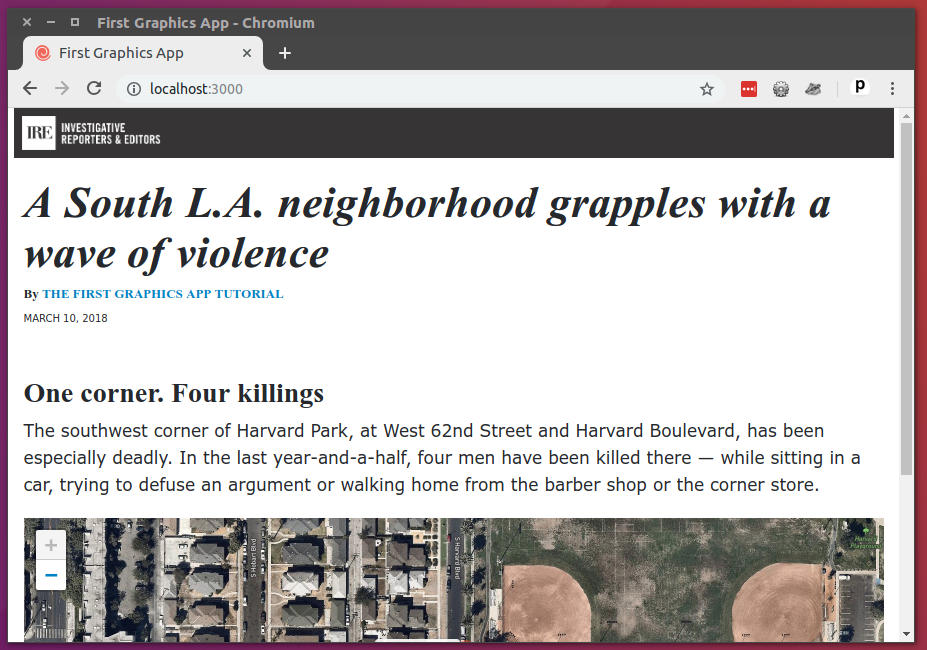
{% block headline %}A South L.A. neighborhood grapples with a wave of violence{% endblock headline %}
{% block byline %}By <a href="https://palewi.re/docs/first-visual-story/">The First Visual Story Tutorial</a>{% endblock byline %}
{% block pubdate %}
    <time datetime="2022-03-05" pubdate>Mar. 5, 2022</time>
{% endblock pubdate %}
And let’s a write a lead at the top of the content block.
{% block content %}
<section>
    <p>The area around Harvard Park was the deadliest place for African Americans in Los Angeles County last year, according to <a href="http://homicide.latimes.com/">The Times’ Homicide Report</a>. So far this year, six people have been killed. Most of the victims were black men.</p>
</section>
<section>
    <h3>One corner. Four killings</h3>
    <p>The southwest corner of Harvard Park, at West 62nd Street and Harvard Boulevard, has been especially deadly. In the last year-and-a-half, four men have been killed there — while sitting in a car, trying to defuse an argument or walking home from the barber shop or the corner store.</p>
    <div id="map"></div>
</section>
Add our work.
git add .
Commit it.
git commit -m "Added map, headline and chatter"
Push to GitHub.
git push origin master
Now we’re ready. Let’s do it live.