3. Building the tiles
The first step is to convert the shapefiles into the GeoJSON format, an open standard that PMTiles makers expect as input. That’s a job for ogr2ogr, a Swiss Army knife for working with mapping data.
It’s part of a broader library called GDAL, which you’ll need to install on your computer. If you’re on a Mac, the easiest way is with the Homebrew package manager:
brew install gdal
After you have GDAL installed, you can run the following command to ensure it’s available in your terminal:
ogr2ogr --version
You should see something like “GDAL 3.11.3 “Eganville”, released 2025/07/12.”
Note
Don’t have Homebrew installed? Visit brew.sh for instructions.
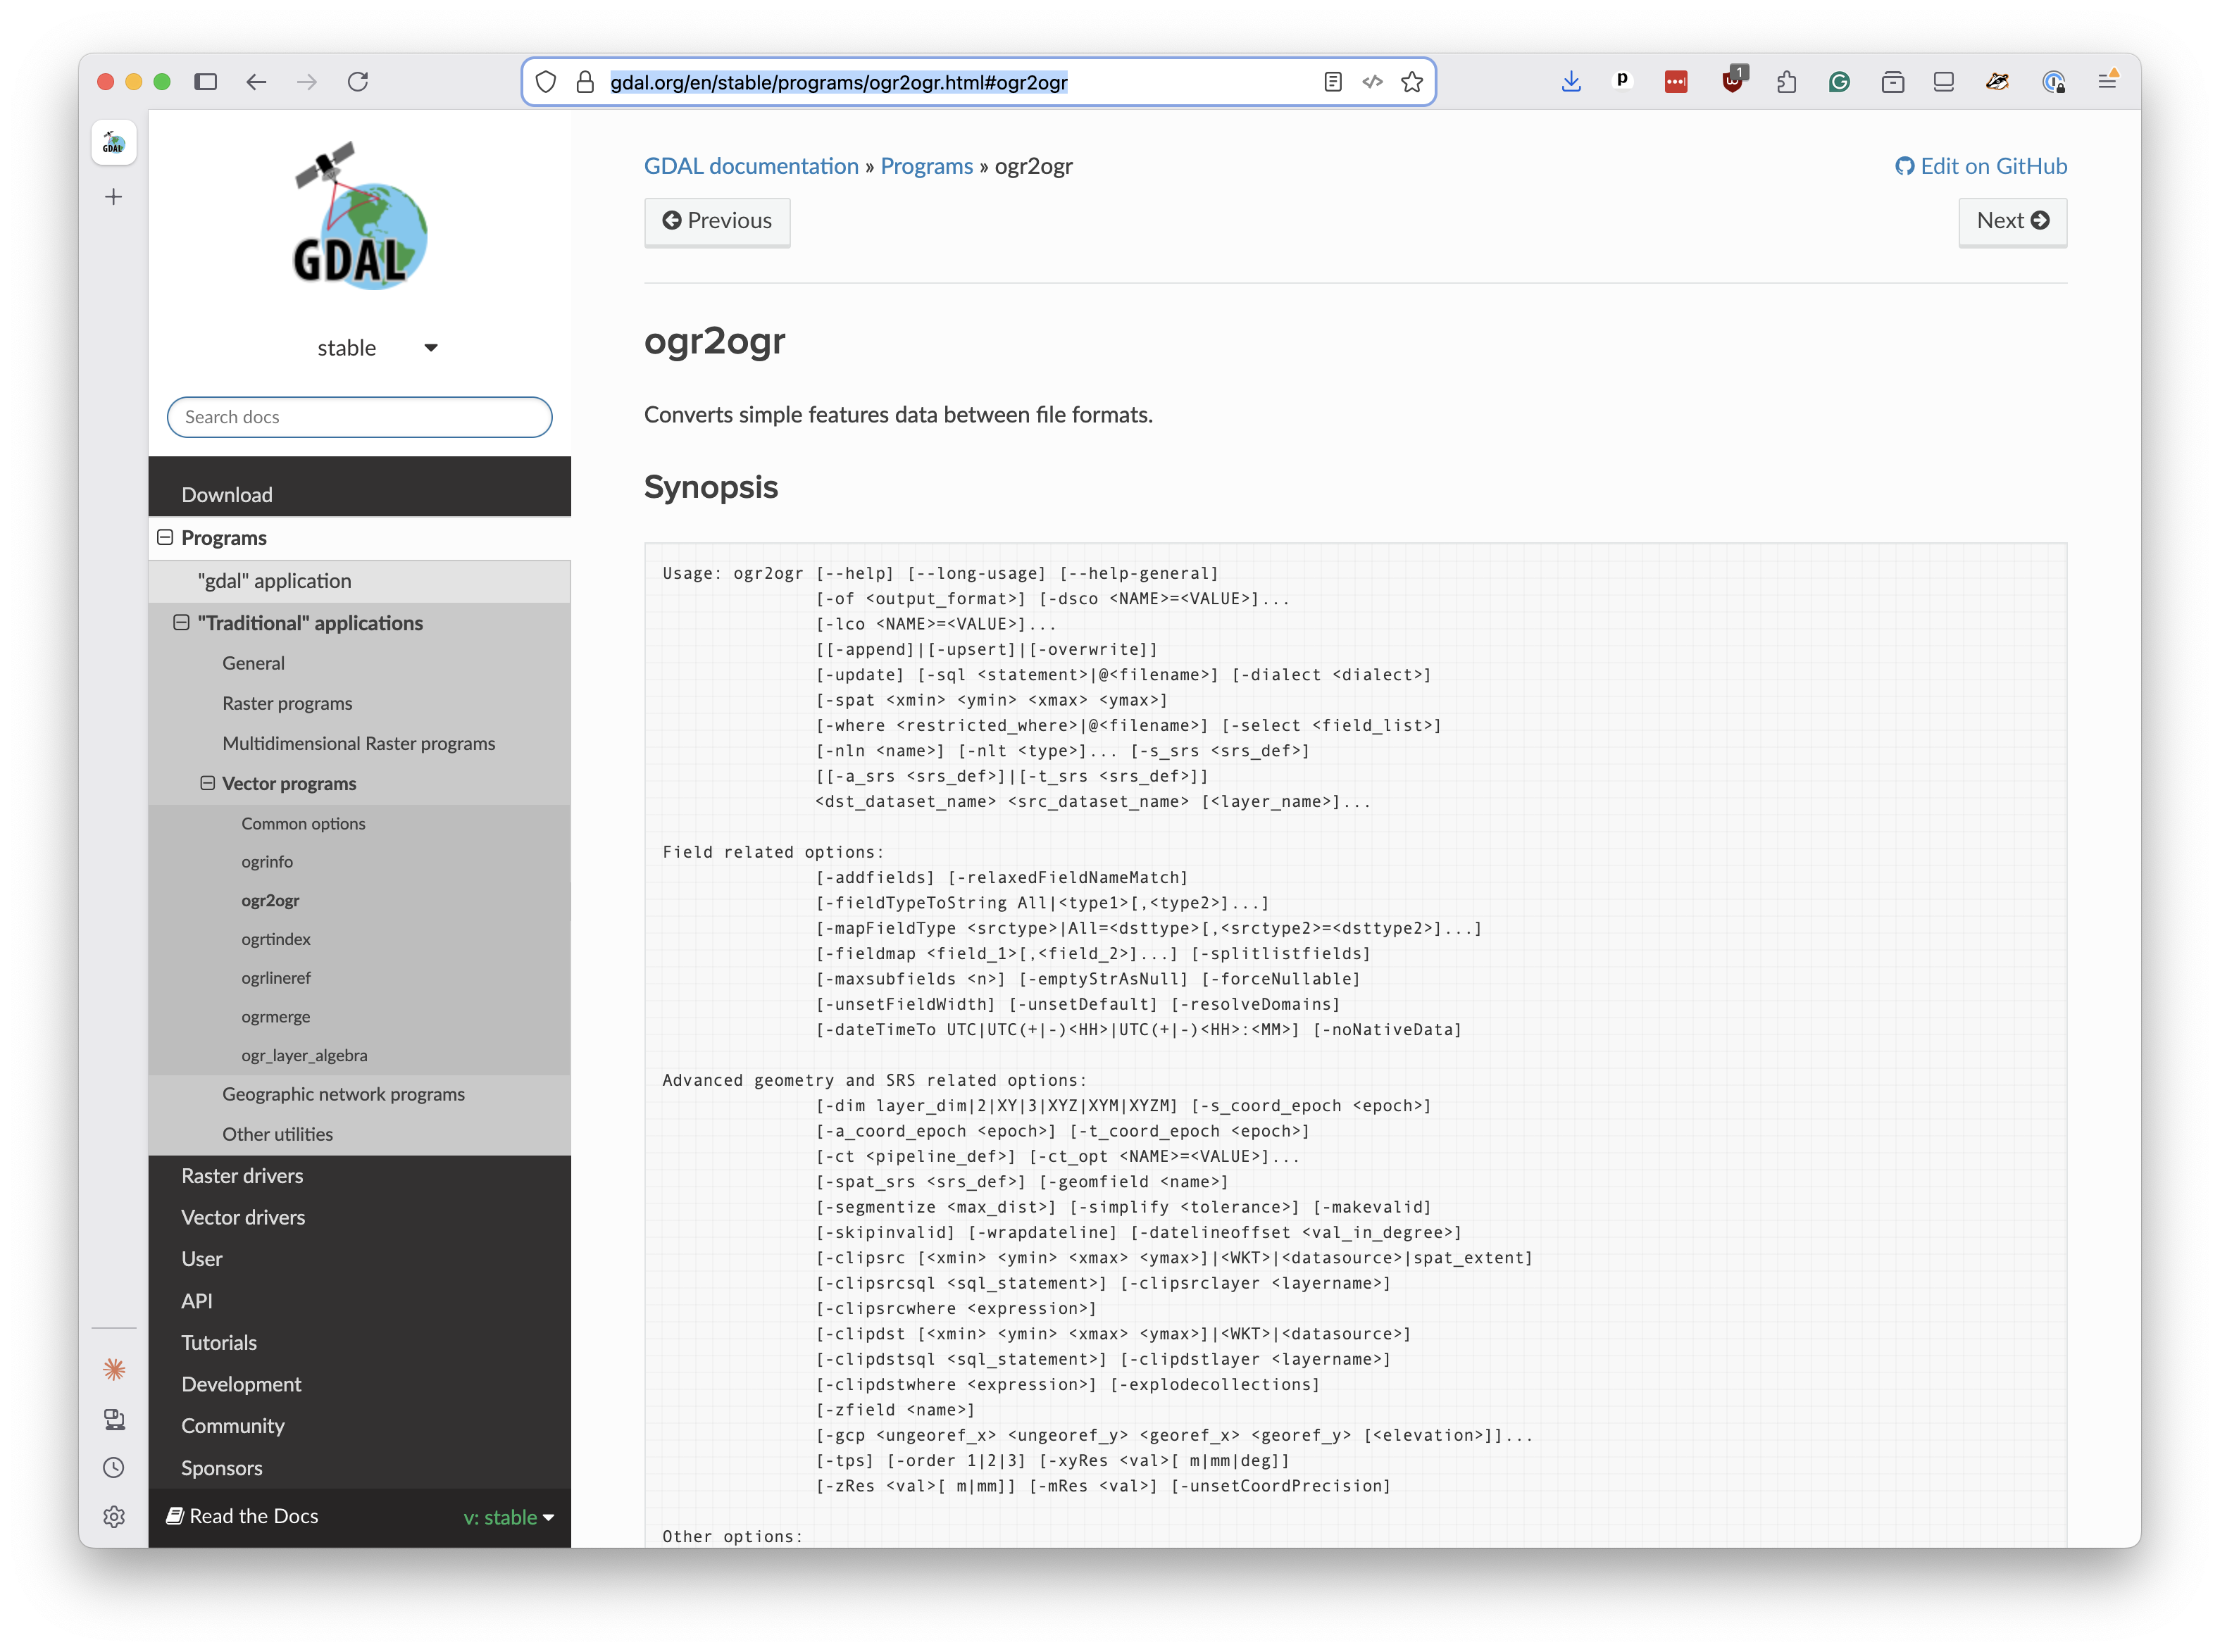
Now that it’s ready, we’ll use ogr2ogr to convert the shapefile into GeoJSON format. The first argument is the name of the output file, the second is the name of the input file. The -f GeoJSON flag tells it to produce GeoJSON output.
ogr2ogr -f GeoJSON ibtracs.geojson IBTrACS.since1980.list.v04r01.lines.shp
This might take some time to complete. When it’s done, you’ll have a GeoJSON file containing every storm track as a polyline feature, with dozens of attributes attached to each one.
Peek at the first few lines with:
head -20 ibtracs.geojson
You can see its massive size with:
ls -lh ibtracs.geojson
Converting the GeoJSON into PMTiles requires another tool called Tippecanoe, an open-source utility originally developed at Mapbox.
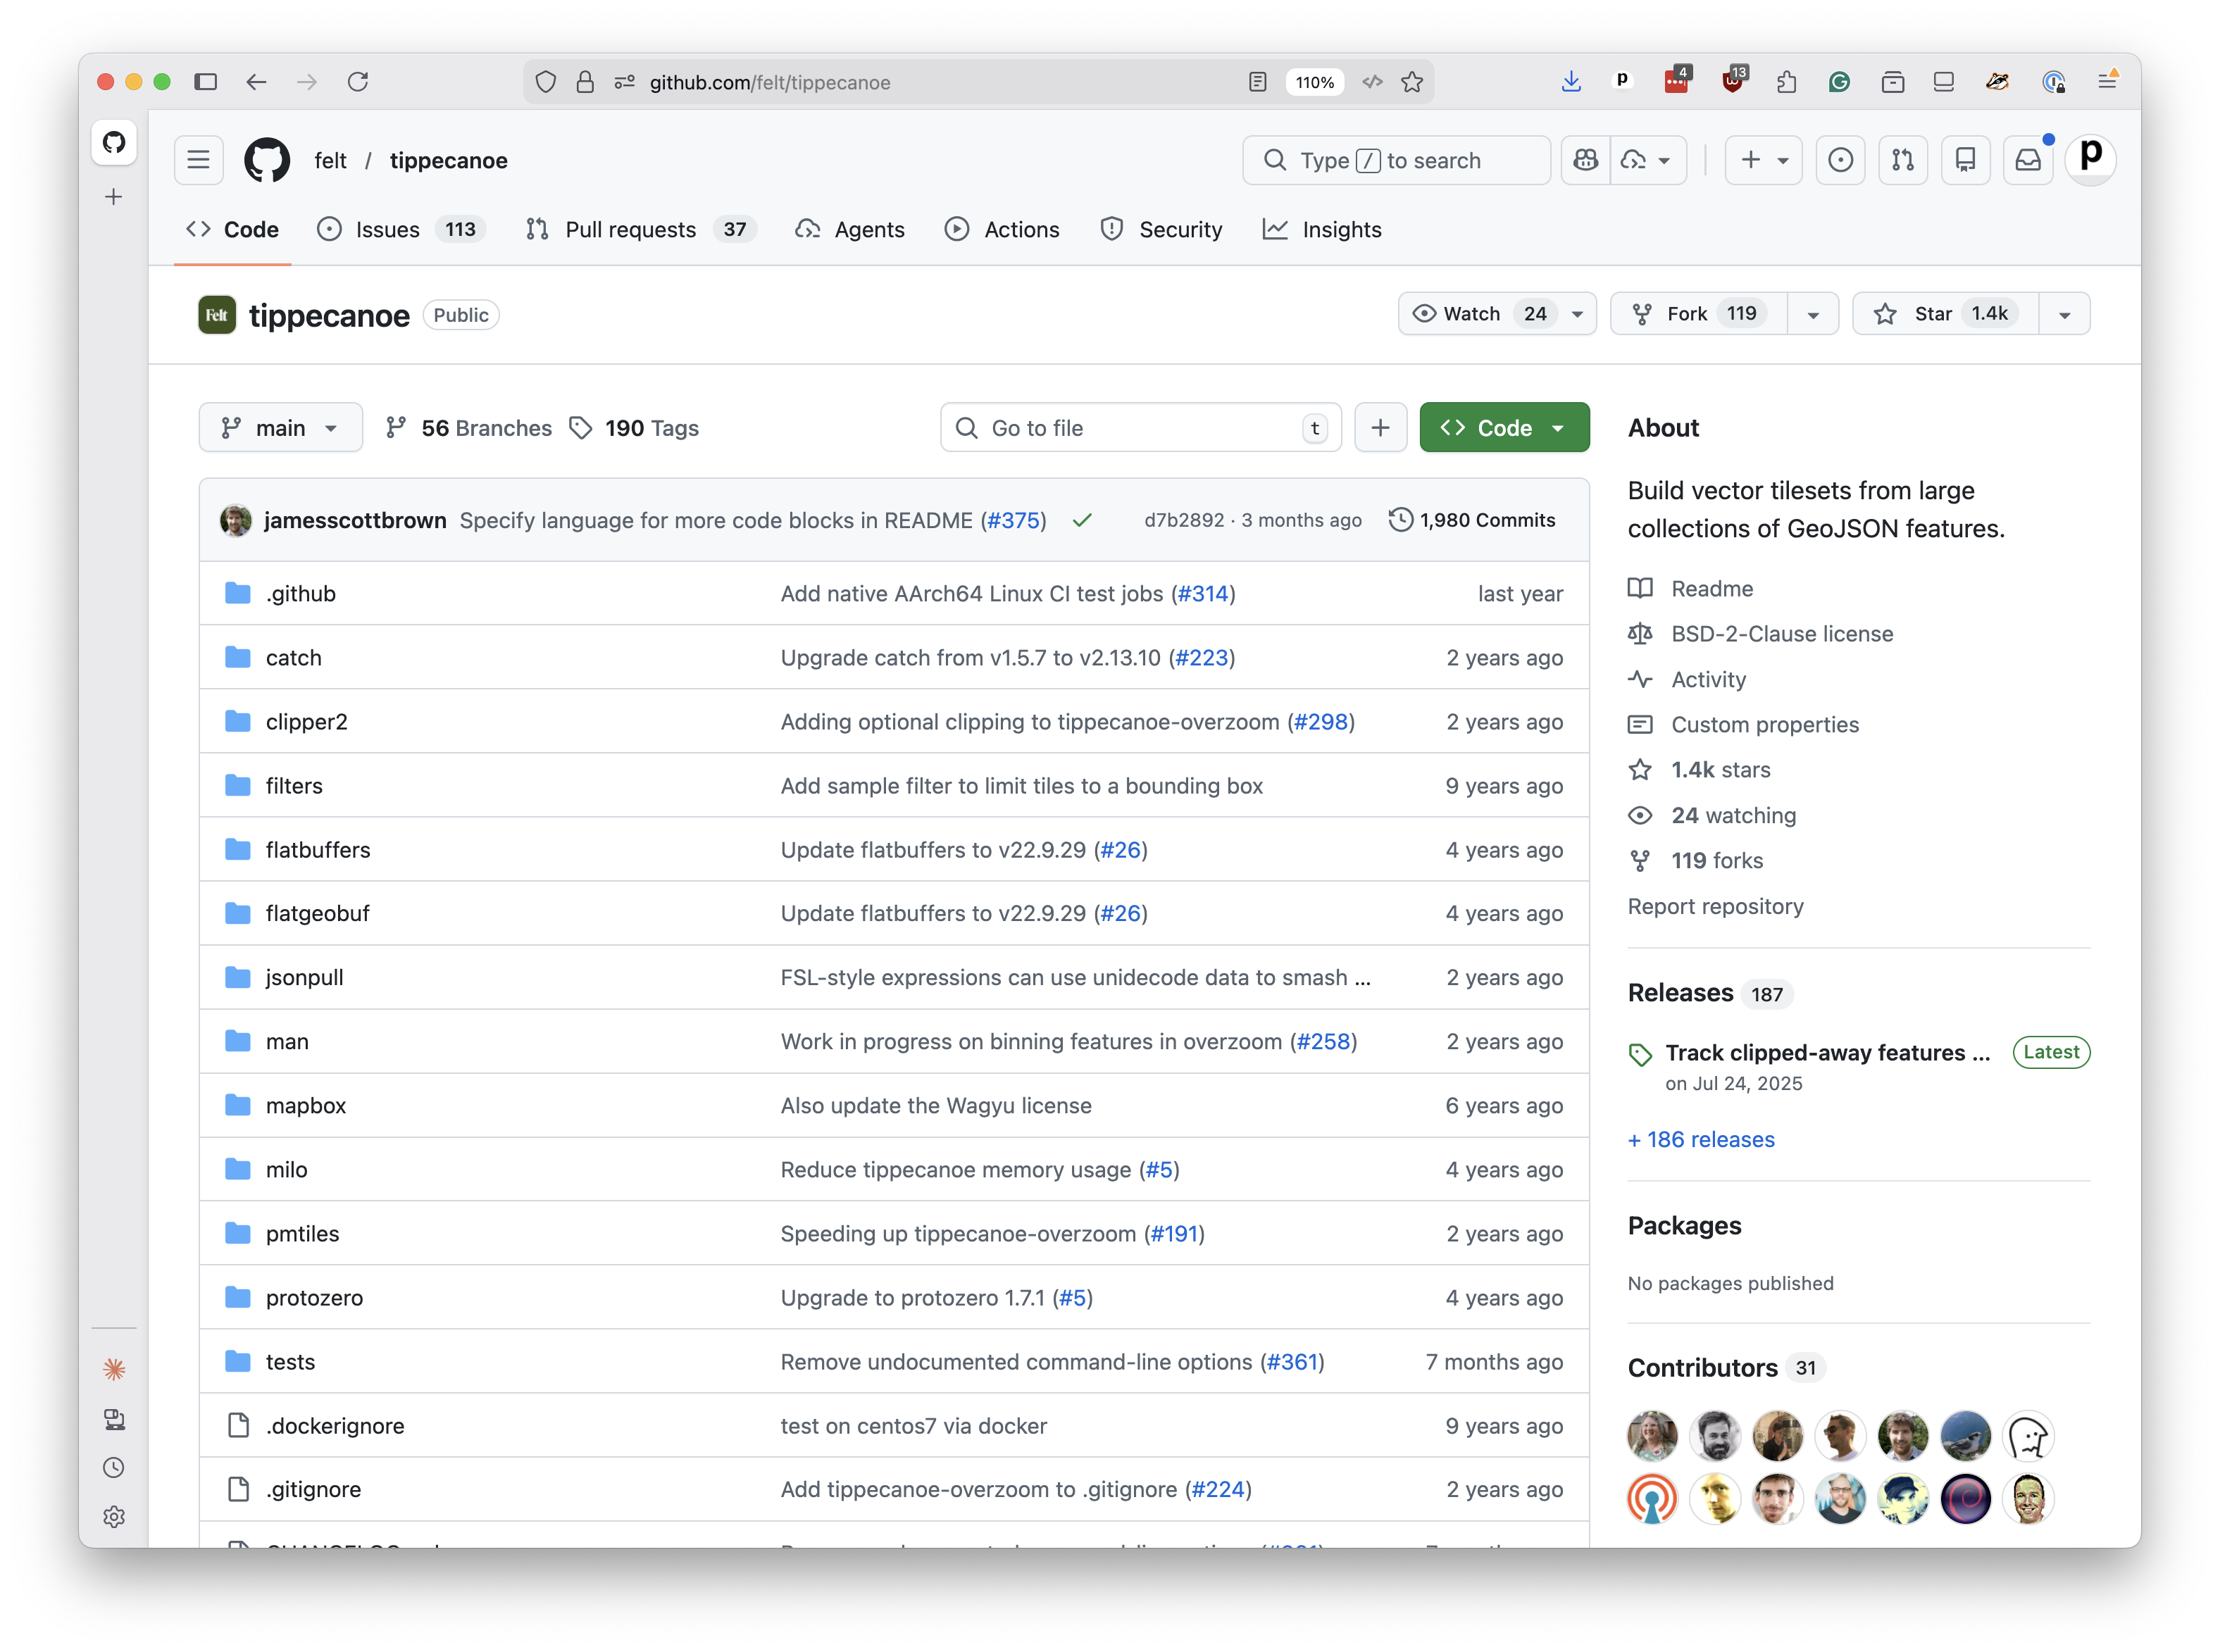
We’ll also install Tippecanoe with Homebrew:
brew install tippecanoe
You can verify it’s installed with:
tippecanoe --version
The tippecanoe command to convert the GeoJSON into PMTiles is more complex. It expects you to dictate how the tiles are built by providing command-line flags—some take values, and some are boolean switches.
The most important flags for our use case are:
Flag |
What it does |
|---|---|
|
Names the output; use a |
|
Sets the layer name inside the tileset; MapLibre will reference this later. |
|
Sets the minimum zoom level for the tileset. |
|
Sets the maximum zoom level for the tileset. |
|
Include all features in each tile, even if tiles get large. |
|
Remove the default tile size cap, allowing larger tiles. |
For interactive maps, zoom levels get higher as you zoom in, with 0 being the whole world and 14 being a close-up view of a city. The more zoom levels you include, the larger the file will be and the longer it will take to build, but the smoother the map will feel when you zoom in.
For this example, we’ll build a file that covers zooms ranging from 0 to 10, which will allow us to zoom in fairly close to the storm tracks without making the processing time too long.
Including the --no-feature-limit and --no-tile-size-limit is often an important choice when making maps for journalism, where you want to ensure that all of the data is included, even if it results in larger tiles. By default, Tippecanoe will try to keep file sizes down by dropping features from tiles that exceed a certain size, which can lead to missing data on the map.
Putting it all together, the command to build our PMTiles file looks like the following. Give it a try.
tippecanoe \
    --output=ibtracs.pmtiles \
    --layer=storms \
    --minimum-zoom=0 \
    --maximum-zoom=10 \
    --no-feature-limit \
    --no-tile-size-limit \
    ibtracs.geojson
The command can take a few minutes to finish and produce a file called ibtracs.pmtiles.
Note
If you’re interested in optimizing the file size, you can experiment with different zoom levels and the --drop-densest-as-needed flag, which will drop features from tiles that exceed a certain size.
Here is the default command recommended by tippecanoe’s developers. It will automatically drop features and pre-select the zoom levels based on the density of the dataset. It will save space and speed up your map, but it may result in missing data in some circumstances.
tippecanoe -zg -o ibtracs.pmtiles --drop-densest-as-needed ibtracs.geojson
Before we build a map, let’s verify that our PMTiles file contains what we expect. There are several ways to do this.
The quickest option is the web-based viewer at pmtiles.io. Open that URL in your browser and drag your ibtracs.pmtiles file onto the page. You’ll see a preview of the data on a map.

If you turn on the “Inspect features” option, you can click on the storm tracks and see the attributes that were included in the tileset.
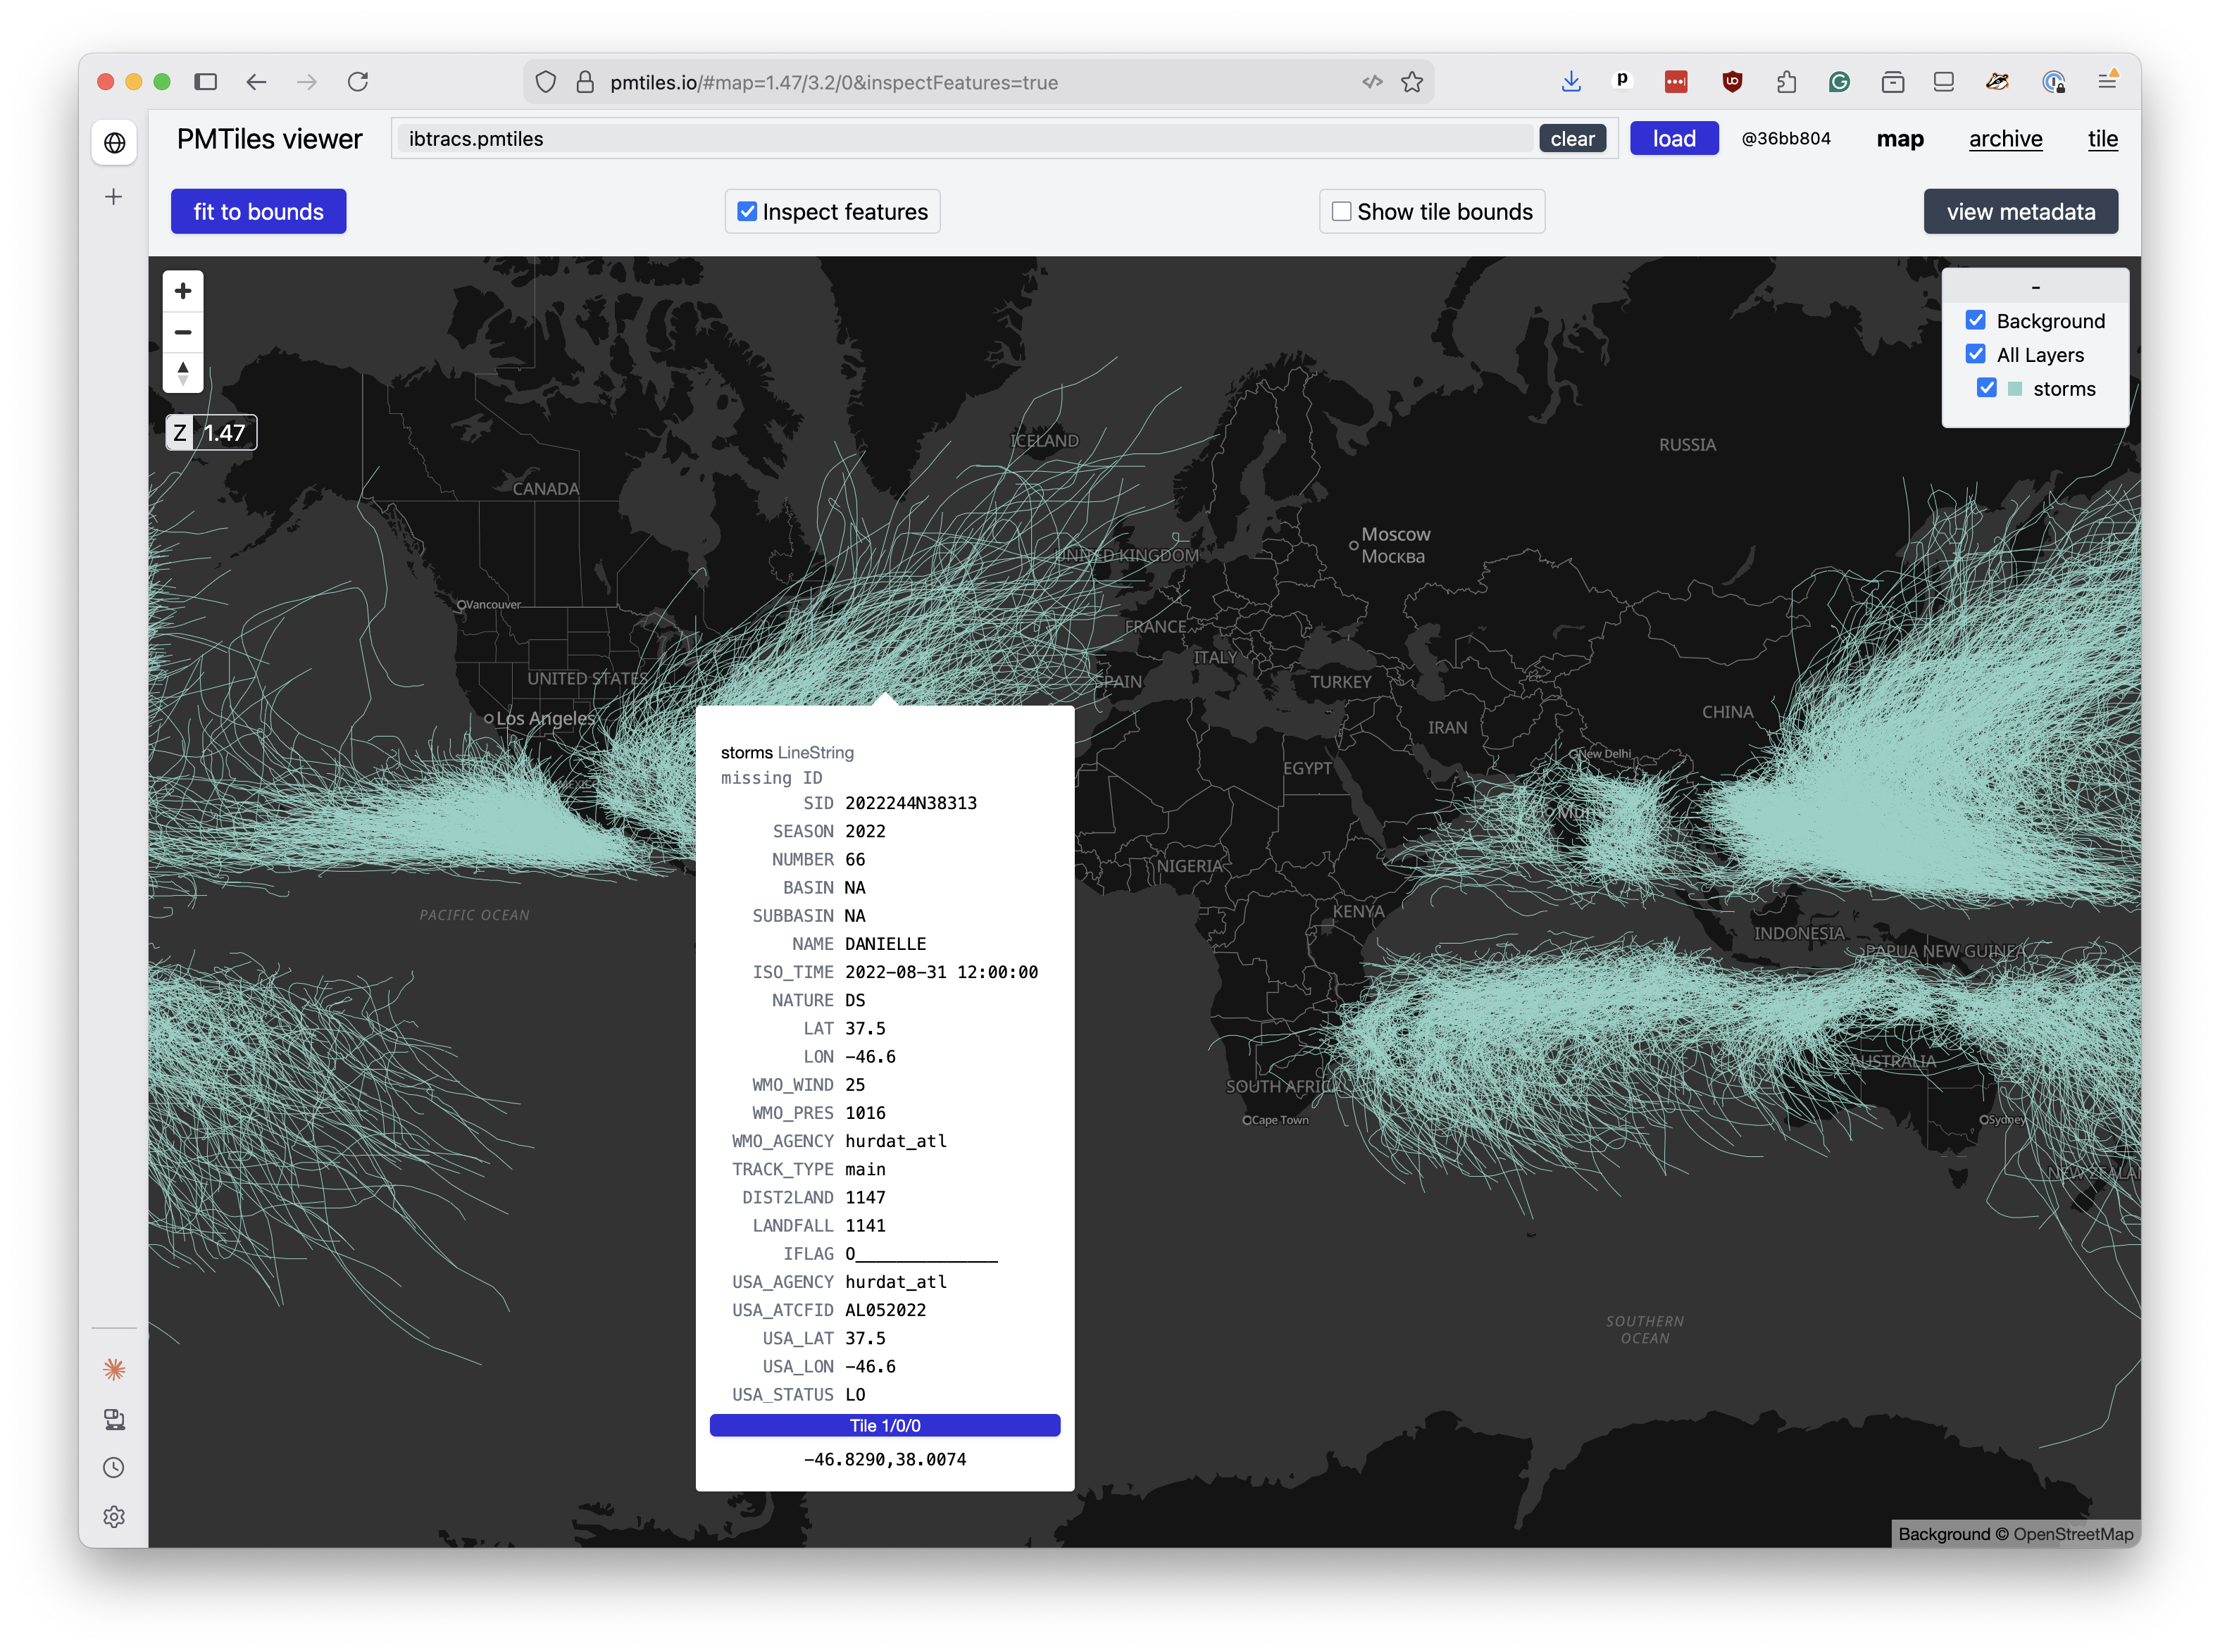
For each feature you should see a long list of attribute fields like NAME and SEASON. Documentation for all the columns is available on the NOAA website.
Two fields will be important for our map:
Field |
Meaning |
|---|---|
|
Classification on the Saffir-Simpson Hurricane Scale |
|
Maximum sustained wind speed (knots). |
Now that we have our tiles, it’s time to put them on a map.