4. Creating the map
Now it’s time to display them on a web page. We’ll use MapLibre GL JS, an open-source library for rendering interactive maps in the browser.
MapLibre displays maps by overlaying your data on top of a basemap that features coastlines, borders, labels and other geographic context. For our basemap, we’ll use OpenFreeMap, which provides open-source map styles with no registration or fees.
Note
In professional newsrooms, the basemap is often provided by an outside commercial mapping service or a custom-built internal map. If you’re interested in learning how to build your own basemap, check out our companion tutorial, “First Basemap.”
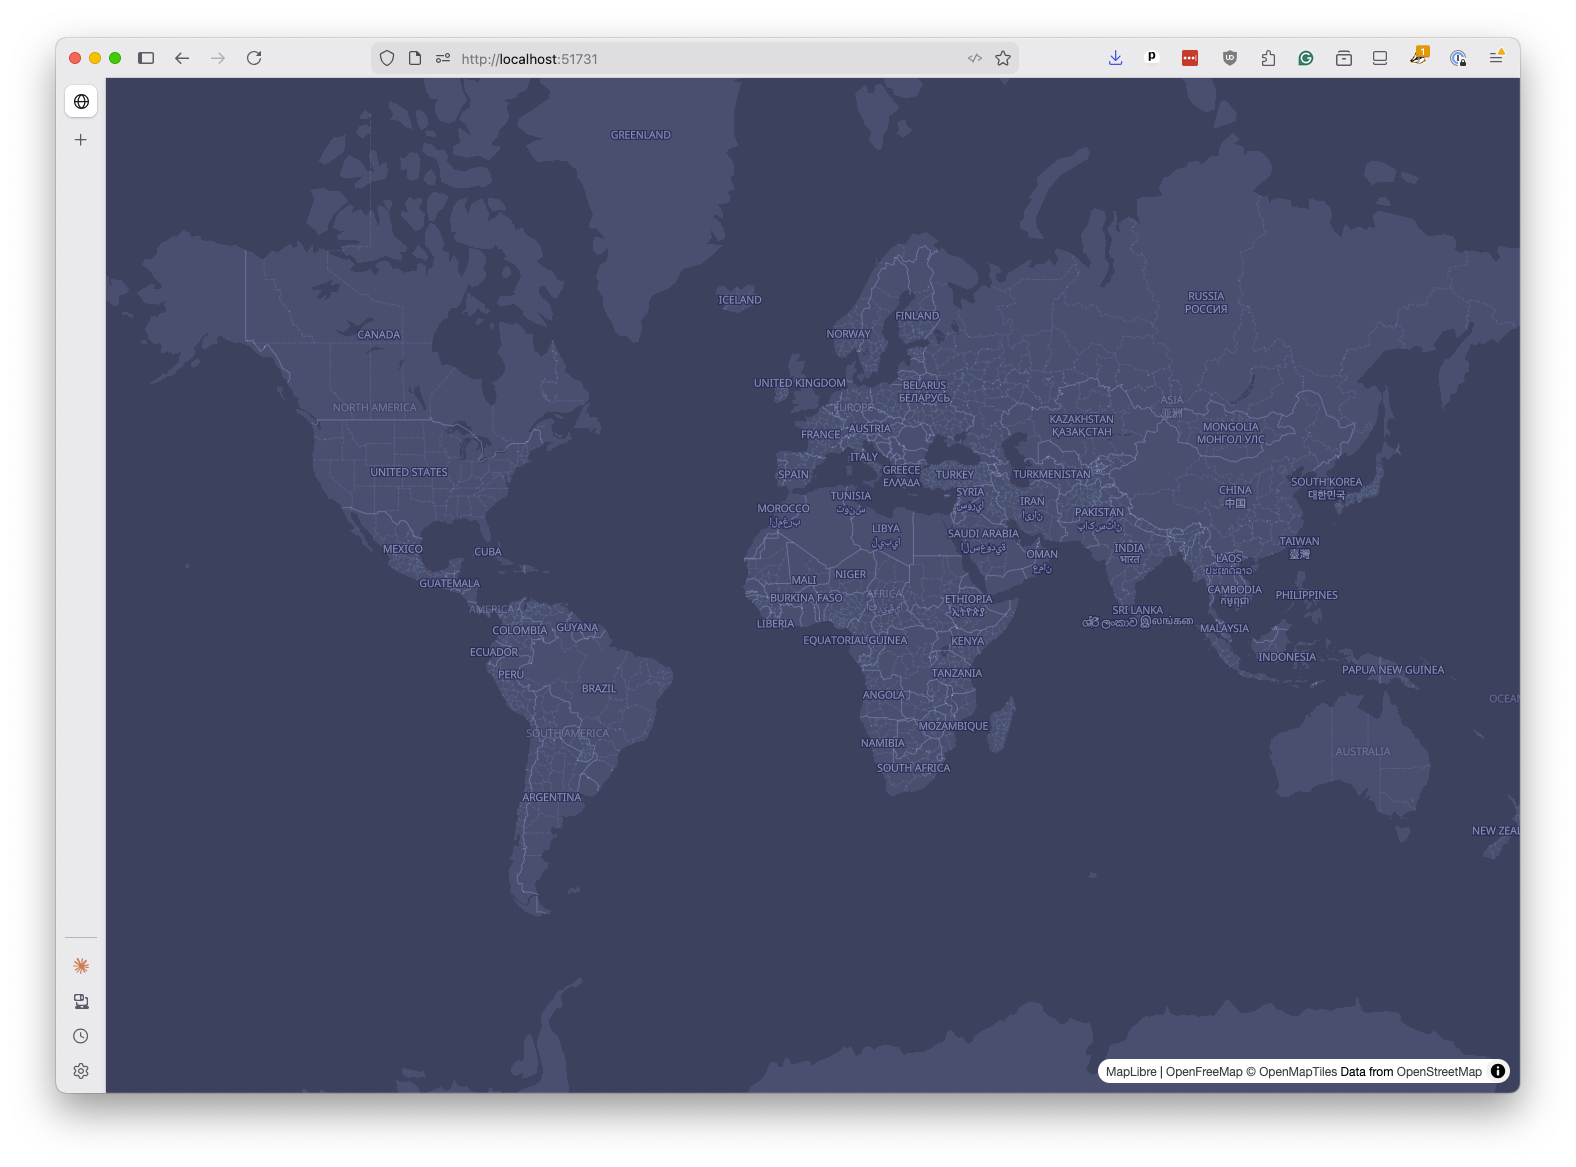
Start by creating a new file called index.html in your project directory. Paste in this boilerplate code to display a blank basemap with OpenFreeMap’s dark “fiord” style:
<!doctype html>
<html>
  <head>
    <script src="https://unpkg.com/maplibre-gl@5.15.0/dist/maplibre-gl.js"></script>
    <link
      href="https://unpkg.com/maplibre-gl@5.15.0/dist/maplibre-gl.css"
      rel="stylesheet"
    />
    <style>
      body {
        margin: 0;
      }
      #map {
        width: 100vw;
        height: 100vh;
      }
    </style>
  </head>
  <body>
    <div id="map"></div>
    <script>
      const map = new maplibregl.Map({
        container: "map",
        style: "https://tiles.openfreemap.org/styles/fiord",
        center: [0, 15],
        zoom: 1.5,
      });
    </script>
  </body>
</html>
Let’s walk through what’s happening. The <script> and <link> tags in the <head> load the MapLibre GL JS library and its stylesheet from a CDN. The CSS makes the map fill the entire browser window.
In the JavaScript, we fetch OpenFreeMap’s fiord style. Once it loads, we create a new map centered on the equator at zoom level 1.5.
In order to see the map, you need to serve the index.html file from a web server. You can’t just open it directly in your browser. PMTiles relies on HTTP range requests to fetch only the bytes it needs, and not every server supports them. Python’s built-in http.server module, for instance, does not.
The easiest option is npx serve, which comes with the Node.js programming language.
Open your terminal and from your project directory run the following command:
npx --yes serve --listen 8000
This will start a server on port 8000. Leave it running in its own terminal tab.
Visit http://localhost:8000 in your browser to verify it’s working. You should see the OpenFreeMap basemap, but no storm tracks yet.
Note
Don’t have Node.js installed? You should follow the installation instructions on the official website.
Now let’s load our storm data. This requires the PMTiles JavaScript library and a few lines of code to register it with MapLibre.
First, add the PMTiles script tag to the <head>, right after the MapLibre script:
<head>
  <script src="https://unpkg.com/maplibre-gl@5.15.0/dist/maplibre-gl.js"></script>
  <script src="https://unpkg.com/pmtiles@3/dist/pmtiles.js"></script>
  <link
    href="https://unpkg.com/maplibre-gl@5.15.0/dist/maplibre-gl.css"
    rel="stylesheet"
  />
  <style>
    body {
      margin: 0;
    }
    #map {
      width: 100vw;
      height: 100vh;
    }
  </style>
</head>
Now update the <script> block at the bottom to register the PMTiles protocol and add our tileset as a map source. Replace the existing script with:
<script>
  const protocol = new pmtiles.Protocol();
  maplibregl.addProtocol("pmtiles", protocol.tile);
  const tilesUrl = new URL("ibtracs.pmtiles", window.location.href).href;

  const map = new maplibregl.Map({
    container: "map",
    style: "https://tiles.openfreemap.org/styles/fiord",
    center: [0, 15],
    zoom: 1.5,
  });

  map.on("load", () => {
    map.addSource("ibtracs", {
      type: "vector",
      url: `pmtiles://${tilesUrl}`,
    });
  });
</script>
The first two highlighted lines are the key to making PMTiles work. They create a protocol adapter and register it with MapLibre under the pmtiles:// prefix. From that point on, any URL that starts with pmtiles:// will be handled by the PMTiles library, which knows how to fetch individual tiles from the archive using range requests.
The third line constructs the URL to our ibtracs.pmtiles file. We use window.location.href to get the base URL of the current page, which ensures it will work even if we are running on a different port or hosting the page at a real URL. What you put here will ultimately depend on how you choose to host your PMTiles file.
Inside the map.on("load") callback, we use the standard Maplibre technique to add our tiles as a data source named "ibtracs". The url uses the pmtiles:// prefix, which triggers the protocol adapter.
Save and refresh your browser. The map will look exactly the same. That’s because we’ve loaded the data but haven’t told MapLibre how to draw it yet.
Styling your data requires that you add a layer that references the source. Add the following code inside the map.on("load") callback, right after addSource:
map.on("load", () => {
  map.addSource("ibtracs", {
    type: "vector",
    url: `pmtiles://${tilesUrl}`,
  });

  map.addLayer({
    id: "storms-line",
    type: "line",
    source: "ibtracs",
    "source-layer": "storms",
    paint: {
      "line-color": "#ffffff",
      "line-width": 1,
      "line-opacity": 0.5,
    },
  });
});
The addLayer method expects a complex configuration object that links it to a source and controls how it looks on the map. In this rudimentary example, a new layer named “storms-line” is added with its data drawn from the “ibtracs” source we created in the previous step.
The source-layer property specifies which layer within the PMTiles file to use, which is necessary because a single PMTiles file can contain multiple layers. You may remember that we named our layer “storms” when we created the PMTiles file with tippecanoe, so that’s what we reference here.
The paint property defines the visual style of the lines, setting them to white with a width of 1 pixel and an opacity of 0.5.
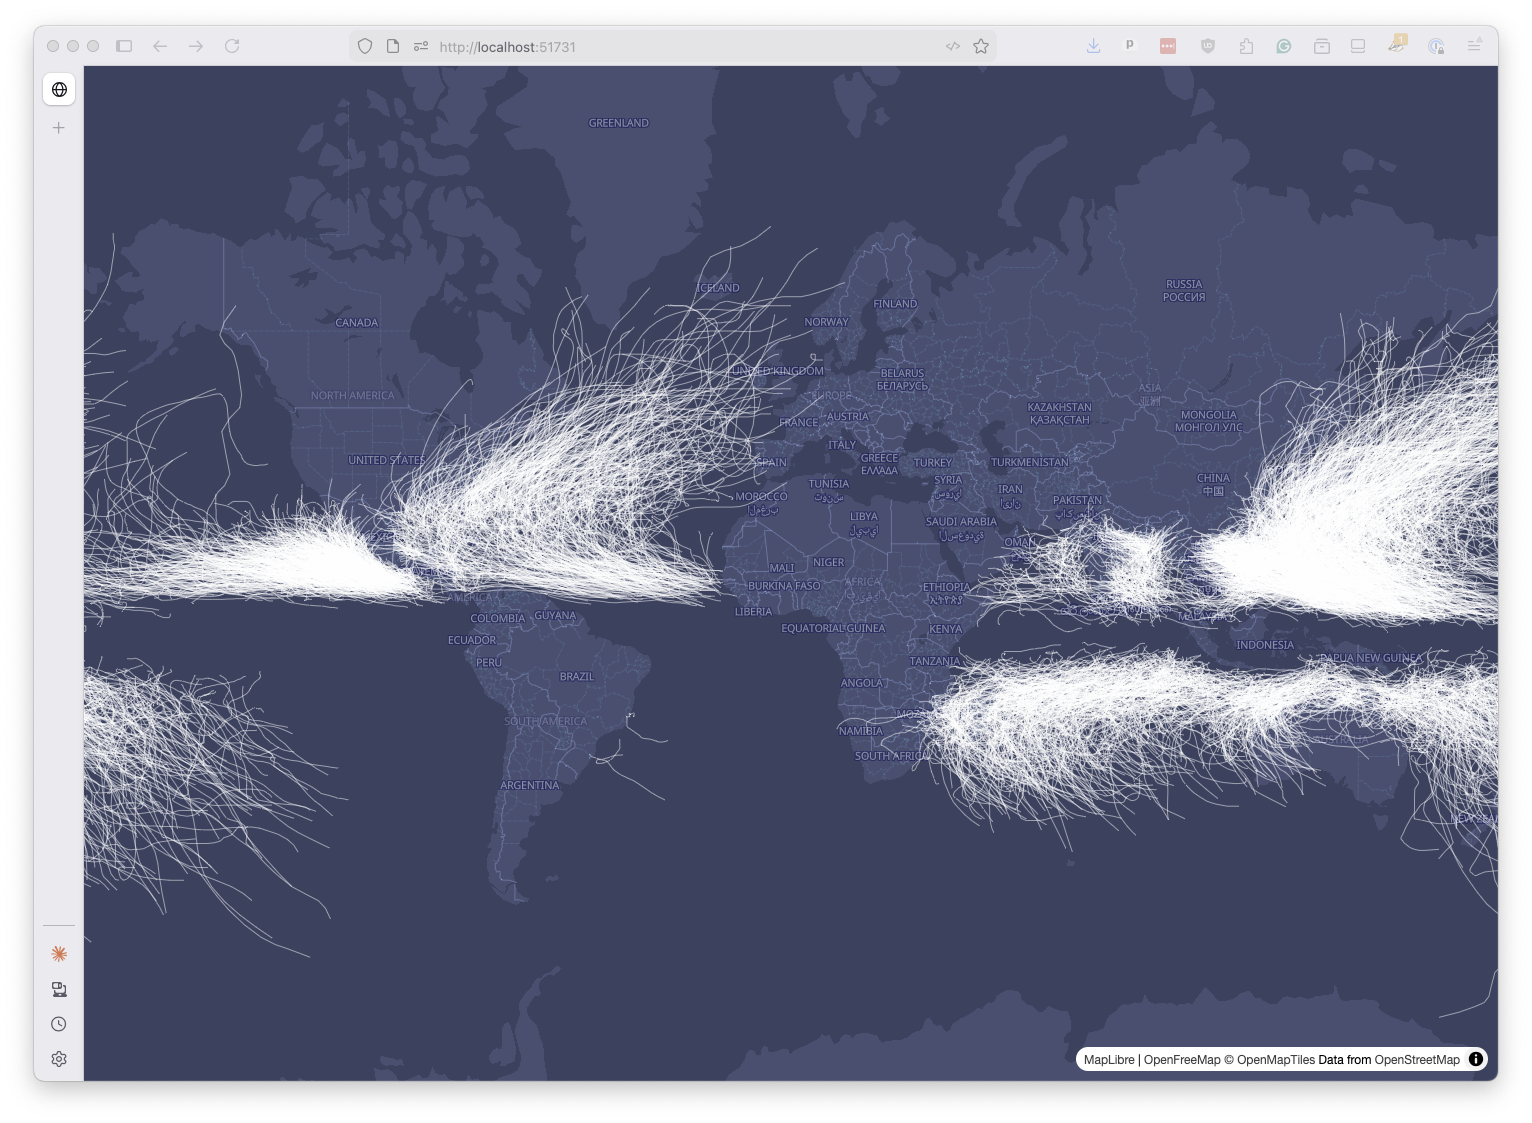
Save and refresh. You should now see thousands of white lines tracing storm paths across the globe. The oceans will be thick with them.
This is just a basic style to get you started. MapLibre offers a wide range of styling options to customize the appearance of your data. We will experiment with some of them in the next chapter.